Use Cases and Requirements for Standardizing Web Maps

Draft Community Group Report

Latest editor's draft:
https://maps4html.org/HTML-Map-Element-UseCases-Requirements/
Editor:
Authors:
Amelia Bellamy-Royds
Nic Chan
Nick Fitzsimons
Robert Linder
Peter Rushforth
Join the Community Group
Maps For HTML Community Group

Abstract

This report outlines the use cases and requirements for standardizing modern Web maps, in a way that works for map content authors, webpage authors, and website users. The use cases and requirements were gathered in consultation with the Maps for HTML Community Group and others.

Three aspects of web maps are reviewed: map viewer widgets, client-side mapping APIs, and map data formats. For each, evidence is gathered from widely-used scripted JavaScript web map frameworks. The common features and limitations of the current techniques are the basis of the requirements for a standardized solution that could be built in to HTML and web browsers.

Status of This Document

This specification was published by the Maps For HTML Community Group. It is not a W3C Standard nor is it on the W3C Standards Track. Please note that under the W3C Community Contributor License Agreement (CLA) there is a limited opt-out and other conditions apply. Learn more about W3C Community and Business Groups.

Comments, corrections, and suggested additions should be made as GitHub issues. If that is not possible, send an email comment to public-maps4html@w3.org.

GitHub Issues are preferred for discussion of this specification.

1. Introduction

1.1 The current state of web maps

Web maps today are indispensable to billions of people, for exploring and understanding the world around them. Like paper maps before them, web maps are used for planning, wayfinding, analysis, and more. But the power of an interactive, hyperlinked medium supports a richer experience than could have been imagined by a cartographer from a previous century. Online maps can be dynamically redrawn with new data, or according to the user's preferences. They can connect to other maps — for adjacent areas, finer detail, or different geographical features — and can link out to complex information about the places they represent.

But despite their ubiquity on the web, maps have no native, semantic representation in HTML.

HTML has had “image maps” — hyperlinked graphics, where selecting different parts of the graphic triggers a different URL — from its early days. These were quickly adopted to represent simple cartographic maps. The <MAP> element sounds like it should be the basis of a web map, but its basic functionality (to define geometric areas on an image that represent distinct hyperlinks) has not evolved to include many capabilities that users today expect when interacting with maps on the web, such as the ability to dynamically change the map view.

Web mapping technology has undergone a long period of evolution. Today's web maps are usually sophisticated client-server applications, dynamically combining many types of spatial data on demand for web users. Implementations vary widely, but some of the underlying techniques, software, semantics and formats have become accepted patterns (for example, the tile naming systems), or formal standards (for example, the standards published by the Open Geospatial Consortium, some of which are also ISO standards).

Many sources of spatial data are available online, from governments, commercial services, and non-profit projects. But accessing and using the data is a specialized task; most web developers or website content creators rely on JavaScript frameworks (or sometimes still Flash frameworks) that can fetch the correct map image tiles or vector data, draw them to the screen, and handle the most common user interactions.

Many of these web map frameworks are tied to a specific commercial provider of map data, making it difficult for website creators to integrate their own data, or data from multiple sources. Many of the web map frameworks do not work at all without JavaScript, and require considerable resource downloads and processing. The end user has limited control or customization over the map interface — unless the website author happened to choose the web map provider that matches the native mapping application on the end-user's device.

Web maps today may not be perfect, but they have filled a clear need for website authors and users. The multiple frameworks used to generate web maps implement the same capabilities with different code — code that needs to be downloaded and processed for each website with a map in it. These core aspects of Web maps represent mature, ubiquitous user interface (UI) and application programming interface (API) patterns. It is now reasonable to consider standardizing these capabilities for implementation by web browsers directly.

A key challenge is to do so in a way that is compatible with the core values of the open web, and integrated with other web platform technologies.

1.2 The Maps for HTML Community Group

The Maps For HTML Community Group (Maps4HTML) arose as a result of face-to-face discussions at the Linking Geospatial Data workshop 2014, co-sponsored by the W3C and the Open Geospatial Consortium.

The group operates within the structure of a W3C community group, with clear license terms for contributions of intellectual property. The community group process designed to support the eventual transition of the group's work to become open web standards. The group attempts to follow the established best practices for web standard development, as outlined in the guiding principles for this report.

The initial requirements sketched out at LGD2014 were expanded into an initial use cases and requirements summary. That work was the basis of the draft Map Markup Language (MapML) specification. Although MapML has had notable support and development efforts from within the geospatial community, as of early 2019 it has not received significant support from web browser developers or HTML standards teams. For that reason, the current document rolls back the focus to the discussion of mapping use cases and requirements. The structure of this report is intended to more comprehensively explain why native HTML web maps would be beneficial, and how they should best be defined.

Editor's note

This report is a work in progress! Feedback and contributions are welcome. Most sections of the report include links to a discussion issue on GitHub. Use those issues to suggest corrections, additions, or changes to the conclusions. To suggest a new section (e.g., a new use case), please start a new issue.

To make substantive contributions (that is, anything that is bigger than typo corrections or formatting fixes), you will need to first become a member of the community group and make the corresponding IP commitments.

1.3 Structure of this report

The purpose of this report is to describe (1) why and how the open web would benefit from having web map features built in to web browsers, and (2) what this native web mapping function should look like, to website creators and to end users.

This report uses an empirical approach to identify required features of web maps, by looking for the common features of web map frameworks used today. However, we also recognize that web maps today have limitations. A proposal for a native HTML web map, built in to web browsers, needs to be assessed on the same merits as any other proposed web standard.

In § 2. Guiding Principles, we outline the theoretical factors we use for assessing whether a given feature should be included as a requirement.

In § 3. Use Cases, we outline common goals for people interacting with web maps. The use cases are defined in pragmatic terms, describing a specific function or action. Real-world, domain-specific applications of the use case are summarized in an introductory description. The use cases are divided according to whether they apply to content creators, website visitors, or web application developers. (Of course, there is overlap between the audiences — good developers want to create good user experiences!)

In § 4. Reviewed JavaScript Tools, we introduce the web map frameworks that are used in the empirical review.

The review of potential requirements is then divided into three parts:

For each category, we list technological capabilities: features, which a web map might include, that could help solve the use cases. Capabilities are potential requirements for a native HTML web map. To assess whether the capability should be a requirement, we examine:

Existing implementations
How common is this capability in the reviewed JS web map frameworks? Do they implement it with consistent, well-established patterns? Are there any notable limitations of the current implementations, when measured against the principles of the inclusive web?
Supported use cases
Which use cases are enabled by this capability?
Uses beyond mapping
Is there a demand for this capability on the web, beyond its use in web mapping?
Related web specifications
How is this capability related to existing web standards or proposed specifications? Can the web map implementation build on existing features?

For each capability, we conclude by summarizing its costs and potential benefits (using tags defined in the next section) for integration as a native HTML web map feature. We assign it one of three possible conclusions:

requirement
The capability is essential for a native HTML web map implementation.
enhancement
The capability would be nice to have in native HTML web maps, but isn't necessary for the initial specification.
impractical
The capability isn't currently realistic for inclusion in native HTML web maps.

If there is not yet enough evidence for a conclusion, the capability will be marked undecided.

1.4 Glossary of key terms

Web mapping and geospatial data have a rich vocabulary that is not always clear to outsiders. This report uses the following terms in the ways defined here, unless another meaning is clearly specified:

map
A graphical representation of the features of and spatial relationships between places. Unless otherwise specified, maps referred to in this report are assumed to be geographic maps with a two-dimensional representation.
geographic map
A map of part (or all) of the surface of Earth (or another planet), with a defined mathematical relationship between positions on the map and geographical positions on the planet.
non-geographic map
A map in which positions on the graphic are not defined relative to positions on the Earth's surface.
interactive map
slippy map
A map rendered as part of an interactive computer application, such that the user of the app can manipulate aspects of the map display. In particular, a slippy map is one in which the user can pan the displayed map to view a different region.
web map
An interactive map integrated into a web page.
geographic information system (GIS)
A database system for managing geographic data (or other spatial data), often including software for displaying the data as interactive maps.
map server
An internet-connected GIS, that provides processed geographic data or map images on request from client software (such as web browsers). Map servers used by web maps are normally built on HTTP, but many formats are used for search requests and data responses. Some of these are described by formal standards, others are defined only by the documentation of a particular map server.
OGC Web Services (OWS)
A set of standards developed by the Open Geospatial Consortium (OGC) that define communication protocols between map servers and client software. OWS standard define a format for exposing the available capabilities of the map server, and for structuring requests for map data for a certain region, possibly restricted by other search parameters. The format of the returned map data is defined separately. OWS standards include:
  • Web Map Service (WMS), for accessing a custom processed map image that directly represents the requested region and query parameters
  • Web Map Tile Service (WMTS), for accessing pre-processed map tiles, which may only represent a layer of the final map
  • Web Feature Service (WFS), for accessing vector feature data
  • Web Coverage Service (WCS), for accessing raw coverage data
  • OWS Context, for returning metadata with references to other map services
(map) projection
A method of converting positions on the surface of a sphere (the Earth) into positions in a 2D rendering (display screen or paper map). All map projections involve some distortion of the data, but different projections are preferred for different use cases. TODO: Figure comparing common map projections
coordinates
coordinate pair or coordinate triple
A mathematical description of a particular location, on a map (map coordinates) or in reality (geographic coordinates). Coordinates are generally defined as a pair or triple of measurements, depending on whether the location they defining is in two dimensions (e.g., a location on the surface of the Earth or position on a map) or three dimensions.
coordinate reference system (CRS)
A standard way of defining map or geographic coordinates, so that locations can be precisely compared or aligned between different maps, map layers, or spatial data sets. Some CRS are based on geographic coordinates, while others are based on map coordinates and therefore incorporate a map projection into their calculation.
latitude and longitude
Coordinate system for describing positions on the surface of the Earth. Latitude values represent North-South distance from the equator. Longitude values represent East-West distance from a reference line (the prime meridian) that connects the poles. Both values are angles, usually degrees. Latitude and longitude are used in multiple coordinate reference systems; the exact CRS needs to be specified to define a location precisely. TODO: Figure of latitude/longitude
altitude
A coordinate that represents the height of a point above or below a reference surface. A coordinate reference system that uses altitude along with latitude and longitude can define geographic points in 3D space. Altitude is measured in length units, such as meters or feet.
feature
Something of interest on the map. Conceptually, the map feature includes the location or geographic shape of this spatial thing, as well as additional information describing what it is or why it is interesting. This information may be conveyed on the map with text labels or with icons, colors, or other cartographic symbols.
vector feature
A map feature that has a mathematically defined spatial geometry based on coordinate data. Different spatial data structures support different types of vector geometry, but the basic 2D vector feature types are point, polyline, and polygon. TODO: Figure of different types of feature geometries (point, multipoint, polyline, etc.)
coordinate point
point feature
A spatial location defined by a single set (pair or triple) of coordinates. A point has no shape or extent, although in some data formats it may include a level of imprecision or uncertainty.
polyline
A vector feature defined as an ordered list of coordinate points, and the straight lines connecting them. (Where "straight" is relative to the geometry being described, and might be across the surface of a sphere.)
polygon
A vector feature defined as a two-dimensional shape enclosed by a polyline, where the last point on the polyline connects back to the first one. In some data formats, a polygon includes a shape with holes (exclusions) in it, where the hole is defined by a separate enclosed polyline.
coverage
Spatial data that conceptually represents a measurable value that varies across space. In practice, coverage data is usually encoded as a grid of points at a specified resolution, with the data value at each point. This grid of values can often be represented as pixel colors in a raster map layer.
(map) layer
A subset of the map's graphics which could be rendered independently from other graphics for the same region. Multiple map layers can be aligned based on their shared coordinates, then composited together (drawn one on top of another) to create the final map view.
base layer
The map layer that provides the background/bottom layer in the compositing stack. It is usually fully opaque.
overlay
A partially-transparent map layer, designed to be positioned on top of a base layer.
vector map layer
A map layer defined using data structures that describe individual vector features and their coordinates, which is then used as input instructions to drawing code in the map rendering tool. Vector formats can preserve the meaning of the different graphical marks on their page, and allow them to by dynamically styled or altered by the map rendering software. But, that flexibility requires more processing power in the rendering software, and may require more data to represent very detailed graphics.
raster map layer
A map layer defined using raster image formats, which specify the final colors at each position (pixel) in the rendered result. Raster maps can be generated from vector data, or they may be created from photographs or drawings.
tile
A subset of a map layer that represents a particular region of the map, usually a rectangle in a particular map projection. Larger regions of the map can be drawn by rendering multiple tiles side-by-side in a grid. In a slippy map, tiles can be fetched from a server and rendered as needed when the user moves the view to different parts of the map. Tiles can be raster or vector, although raster tiles are currently more common for web maps.
tileset
A set of map tiles which can be used as a map layer. In simplest tilesets, the map tiles combine as a grid (tile matrix) to form a single map layer. More complex tilesets include multiple tile matrices covering the same regions at different scales (zoom levels). TODO: Create/find figure explaining tileset pyramids.

2. Guiding Principles

The structure of this review is inspired by many other projects that have outlined best practices for web standards developments. This section briefly outlines the principles behind our approach, with links to further reading.

2.1 The extensible web

The report uses an evidence-based approach, defining requirements not based on hypothetical use cases but on web map tools that are already in use. We assume that the common features of existing, widely-used web map frameworks represent core functionality that web users and website authors expect from native web maps.

This approach is inspired by The Extensible Web Manifesto which aims to “tighten the feedback loop between the editors of web standards and web developers,” establishing “a clear path for good ideas by web developers to become part of the infrastructure of the web” [EXTENSIBLE].

Much of the manifesto focuses on making it easier for developers to experiment with new features — to expose web platform capabilities at a more granular level, so that developers can remix and extend them to try out new ideas. HTML custom elements and CSS custom properties are just two of many examples of how web standards efforts since 2012 have focused on creating better building blocks for web developers.

But the implicit second step of the extensible web approach is that, once a consensus has developed from real-world experience with particular features or patterns on the web, those features can be standardized with confidence.

Web maps are extremely complex user interfaces. If that complexity is to be built-in to web browsers, the extensible web mindset requires that it be exposed to developers as individual capabilities that can be remixed and extended. For that reason, this review breaks web map functionality into very low-level capabilities. In addition to describing how each capability is used in mapping, we discuss how the same building block could be used for other web content. Focusing on these low-level capabilities also ensures that we do not overlook important details, such as the need to make individual interactions accessible to all users.

2.2 Priorities for web standards

To decide whether a capability should or shouldn't be considered a requirement for web maps, we need to assess its benefits and costs. But benefits and costs are subjective: to calculate them, we need a set of values or principles defining best practices for web standards. Only then can we assess whether integrating a feature into web browsers can bring the web closer to our ideals.

Benefits and costs are also different from different perspectives. Integrating web maps into HTML means convincing other web standard editors and web browser developers. But once a web standard is adopted, the number of website authors who use it will (hopefully) be much larger than the number of people who worked on the initial standard; the number of people who use those websites will be larger still. The HTML Design Principles rely on these numbers to establish a “priority of constituencies”:

In case of conflict, consider users over authors over implementors over specifiers over theoretical purity. … Of course, it is preferred to make things better for multiple constituencies at once. [html-design-principles]

This section introduces the categories by which we measure costs and benefits to each of these constituencies.

2.2.1 Users

An inclusive web is available to everyone, to connect and create in the ways most comfortable to them.

In this report, the user-friendliness of a potential web map feature is assessed on these points:

privacy & security

Can this feature be implemented in a privacy-respecting manner? Are there any other security concerns from this feature? Would making it a built-in feature, standardized in web browsers, improve privacy & security compared to current web practice?

Tags for the costs and benefits of potential requirements:

  • Privacy: potential improvement indicates that a built-in browser implementation of this feature, if done correctly, could improve the protection of the end user's privacy, compared to current practices on the web.
  • Privacy: potential improvement for website origin isolation indicates that a built-in browser implementation of this capability, if done correctly, could make it easier for website authors to use web maps without exposing confidential (user or corporate) data to third parties.
  • Security: potential improvement indicates that a built-in browser implementation of this capability, if done correctly, could improve the protection of the security of the browser environment, compared to current practices.
  • Privacy: involves personal data indicates that in order to fully implement this capability, the browser would have access to sensitive or personally-identifying data about the user, which would need to be protected.
  • Privacy: possible fingerprinting indicates that implementing this capability would expose to website code user settings or data from device sensors, which could make it easier for website trackers to generate a unique “fingerprint” for identifying that user across many sites.
  • Privacy: reveals sensitive data indicates that fully implementing this capability requires revealing sensitive or personally-identifying data to website code.
  • Security: user interface override indicates that this capability allows website code to alter the normal browser UI in a way that could be used by a malicious code to mislead users.
  • Security: other risks indicates that this capability includes other aspects that could make a secure implementation difficult.

Further information:

accessibility

Does including this capability in a web map standard make it easier to ensure an accessible experience (assuming an accessibility-focused browser implementation)?

Related tags:

  • Accessibility: potential improvement indicates that a built-in browser implementation of this feature, if done correctly, could improve the accessibility compared to current practices on the web.
  • Accessibility: research needed indicates that there is not a clear best practice for how to implement this capability accessibly.
  • Accessibility: needs author-provided context indicates that a good browser implementation is not enough to make this capability fully accessible; content author would always need to provide extra information (e.g., alternative text or captions).

Further information:

internationalization & localization

Can this feature be implemented in a manner that works for all languages and regions? Does building it into the browser increase the likelihood that internationalization is done correctly?

Related tags:

  • Internationalization: potential improvement (languages) indicates that a native browser implementation, if done correctly, could improve the handling of text in many languages, compared to current practices in web maps.
  • Internationalization: potential improvement (spatial data) indicates that a native browser implementation, if done correctly, could improve the ability of web maps (compared to current practices) to work in many regions with different ways of describing locations and other spatial data.
  • Internationalization: UI localization required indicates that a correct implementation of this feature would need to include translations or other localizations (e.g., different icons or layout).
  • Internationalization: regional standards indicates that the standard UI patterns or data formats vary by geographic region.
  • Internationalization: difficult to do well indicates that the capability involves other aspects that are frequent sources of internationalization and localization errors.
  • Internationalization: unstable data indicates that a correct implementation depends on information that may change over time , and would need to be updated by the browser.

Further information:

performance & cost to users

Would building in this feature significantly reduce the amount of data downloaded to the user device, or the amount of custom code that needs to run? Or would it impose heavy computation demands on the user device?

Related tags:

  • Performance: data savings indicates that making this a browser feature could reduce data demands on the user's network. Of course, nearly any built-in capability will create some data savings compared to downloading JavaScript to achieve the same effect; this tag is only used when the potential data savings are particularly notable.
  • Performance: potential optimization indicates that a native browser implementation could be much more efficient in its computation requirements, compared to JavaScript tools.
  • Performance: high cost feature indicates that this feature involves high performance costs, regardless of whether it is defined in browser code or in JavaScript.

Further information:

    Issue
  • Need references regarding performance considerations for spec developers.

2.2.2 Authors

Website authors include developers who write code and writers, designers, and other creators of web content. When discussing web maps, website authors also include geospatial experts who create map data and want to publish it on the web.

For an author that cares about their user, it of course helps if there are native implementations of author-focused features like accessibility. But there are other ways a good web standard can make the author's job easier:

simplicity & flexibility

For an author, a good web standard should make it easy to create common web patterns, while still making it possible to create unique and customized experiences.

Related tags:

  • Author experience: simple defaults indicates that the capability would greatly simplify authoring common use cases.
  • Author experience: extensible indicates that the capability provides an important hook for extending the basic web map experience.
  • Author experience: customizable design indicates that the capability is needed to allow authors to customize the appearance of web maps to better integrate with their site design (while still using other web map capabilities).
maintainability & cost to authors

Do current implementations of the feature rely on third-party services which may change in ways that could break website content? Do they involve ongoing costs that could be mitigated by a native version of the feature?

Related tags:

  • Author maintainability: removes dependencies on third-party services indicates that current implementations cannot be fully self-hosted by the website, creating a third-party dependency that could be removed with a native HTML capability.
  • Author maintainability: cost savings indicates that current web map implementations of the feature have ongoing service costs which could be mitigated by integrating with native platform versions of the feature.
consistency & coordination with the existing web platform

Can this feature be defined in a way that integrates well with the rest of the web? Does it reuse API and markup patterns that authors already know? Can it be added to websites in a way that degrades gracefully in unsupporting web browsers?

Related tags:

  • Consistency: established patterns indicates that this capability can be modelled after an existing concept or pattern in the web platform.
  • Consistency: progressive enhancement indicates that this capability could be included in websites as an optional enhancement of existing functionality.
  • Consistency: fallbacks possible indicates that this capability could be designed to support degradation to a fallback state (with corresponding loss of function or extra costs).
  • Consistency: platform is inconsistent indicates that it will be difficult to make this feature consistent with the web platform, because existing platform features are inconsistent with each other.
  • Consistency: breaks established patterns indicates that the feature would be clearly inconsistent with other aspects of the web platform.

Further information for all authoring & API design considerations:

2.2.3 Implementers

Implementers, for a web standard, are the people who build and maintain web browsers and other user agent software. Because much of the work of a web browser is to work as the user's agent, features that are good for the user when it comes to security or performance are also good for implementers. But some implementer benefits aren't directly exposed to the user:

ease of implementation

An implementation that already exists is always easier. Could this feature reuse code that is already available to the browser?

Related tags:

  • Implementation: Extends web platform indicates that this capability is an incremental extension of existing web platform features, and could be designed to reuse a lot of existing code.
  • Implementation: Exposes native platform indicates that, while this capability is not currently available in the web platform, it exists in native application frameworks supported by the major operating systems. A web browser could expose the native feature instead of re-implementing it from scratch.

3. Use Cases

The basic use cases for website authors focus on presenting information. Different types of map data require different display capabilities. More advanced geographic application development End users may wish to use that information in ways that go beyond what the website author intended; those use cases are grouped separately.

3.1 Content author use cases

3.1.1 Display an interactive map within a web page

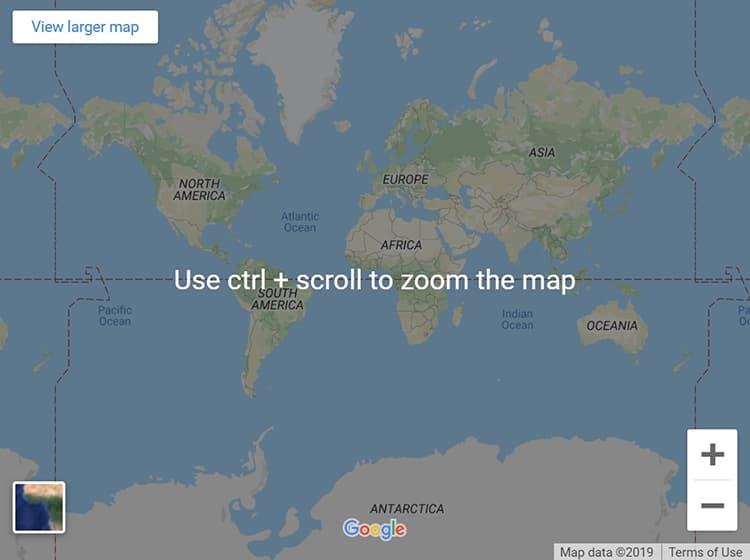
Before discussing any extra capabilities, there must be some way to define a map viewer in a web page, either from markup or from script.

Maps on the web are used to give directions, to display data, to tell stories, and to teach geography, among many other uses. Of course, most use cases require additional capabilities — this is just the foundation!

Google Maps example: Create a basic map.
Figure 1 Google Maps example implementation of "Display an interactive map within a web page".

See examples of creating a basic map as implemented by the reference JavaScript tools.

Issue 77: Use Case: Display an interactive map within a web page discussion: use casestatus: editor's draft

Discuss this section on GitHub.

Required capabilities

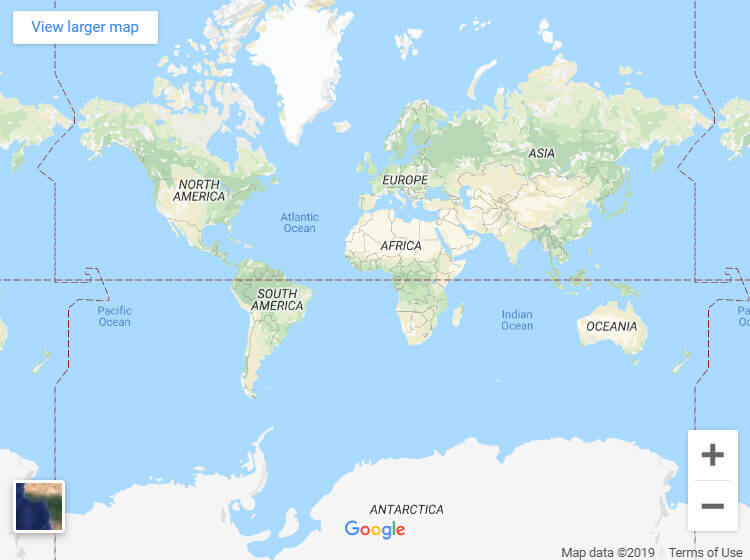
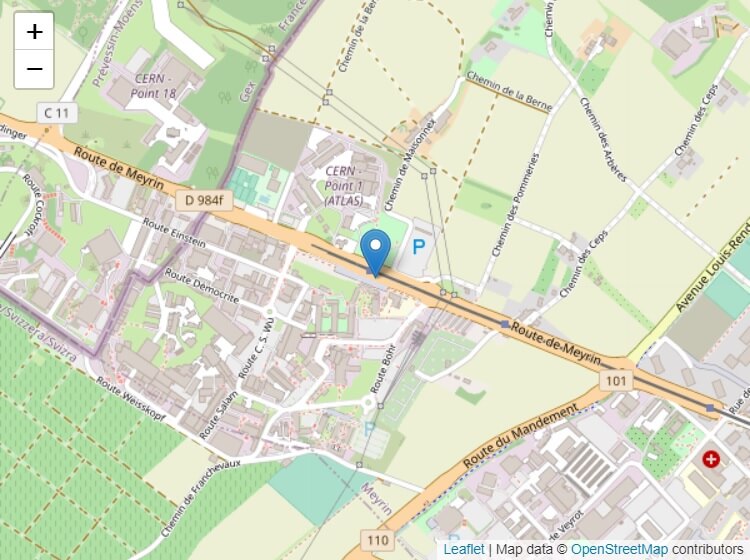
3.1.2 Display a map centered on a point location

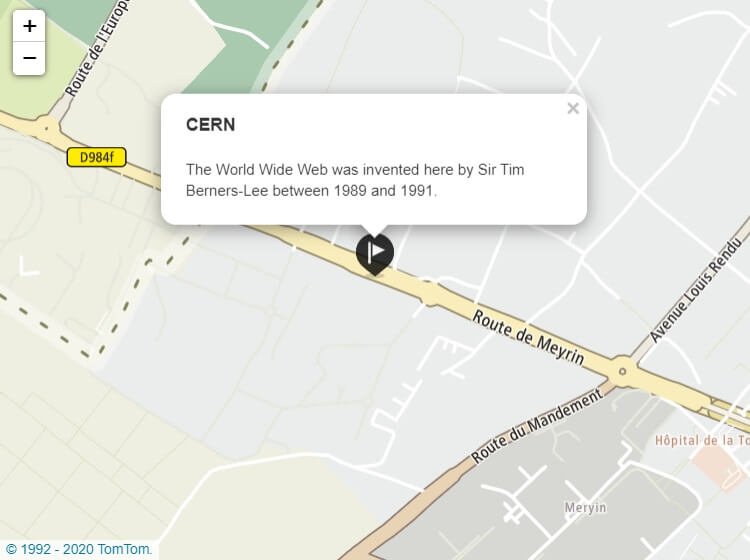
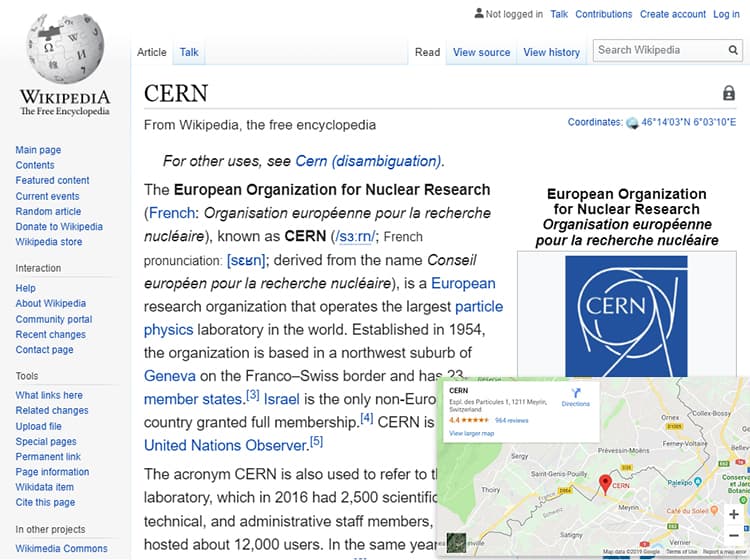
For a website creator, this is the simplest web map use case: display a map from a location description. Usually, the map layer is at a zoom level that shows streets and points of interest, with a pinpoint marker showing the specific location.

This type of web map is used by websites for stores, restaurants, and countless other organizations with physical locations. It is also used by news media to display the location described in an article. In social media and blogs, a single-location map can be used to show where a post was uploaded from, or where a photograph or video was taken.

Leaflet.js (with OpenStreetMap tiles) example: Single-location map viewer.
Figure 2 Leaflet.js (with OpenStreetMap tiles) example implementation of "Display a map centered on a point location".

See examples of single-location map viewers as implemented by the reference JavaScript tools.

Issue 33: Use case: Display a location on a map discussion: use casestatus: editor's draft

Discuss this section on GitHub.

Required capabilities

3.1.3 Display a region of map data as a static image

Although this review mainly focuses on interactive map viewers, authors sometimes want a map displayed as a static image, without pan/zoom capabilities. This is common in cases where the accompanying text refers to specific features in the map, or when a series of maps will be contrasted.

MapBox Static Images example: Display a static image.
Figure 3 MapBox Static Images example implementation of "Display a region of map data as a static image".

See examples of static map displays as implemented by the reference JavaScript tools.

Discuss this section on GitHub.

Required capabilities

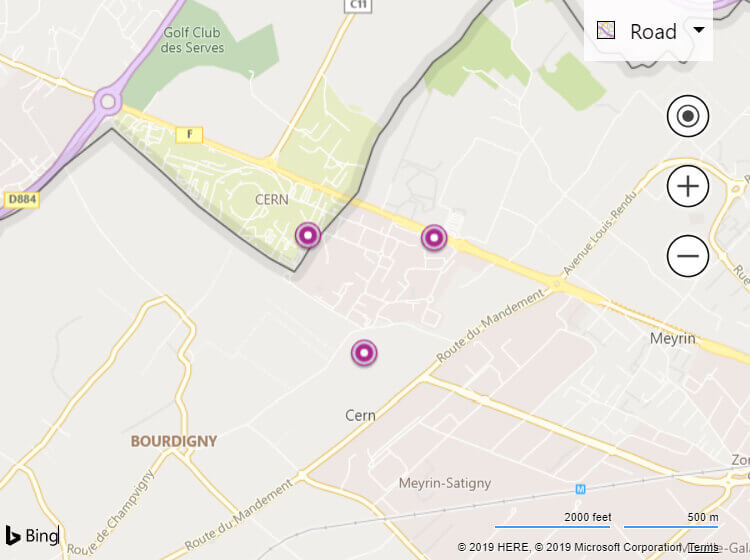
3.1.4 Display multiple point locations as map markers

The most common use case for a web map is to show one or more locations of a business or organization. Maps that display pinpoint locations can also be used for data visualization, demonstrating spatial patterns of particular events or occurrences. Other examples of point markers on a map include search results (e.g., restaurants), traffic information (e.g., locations of construction roadworks), or the locations where photographs in a gallery were taken.

For many use cases, the website author will want to choose the icon used to mark the location, with different markers for different types of point features.

Bing Maps Control API example: Display multiple point locations as map markers.
Figure 4 Bing Maps Control API example implementation of "Display multiple point locations as map markers".

See examples of displaying multiple point locations as map markers as implemented by the reference JavaScript tools.

Issue 78: Use Case: Display multiple point locations on a single map discussion: use casestatus: editor's draft

Discuss this section on GitHub.

Required capabilities

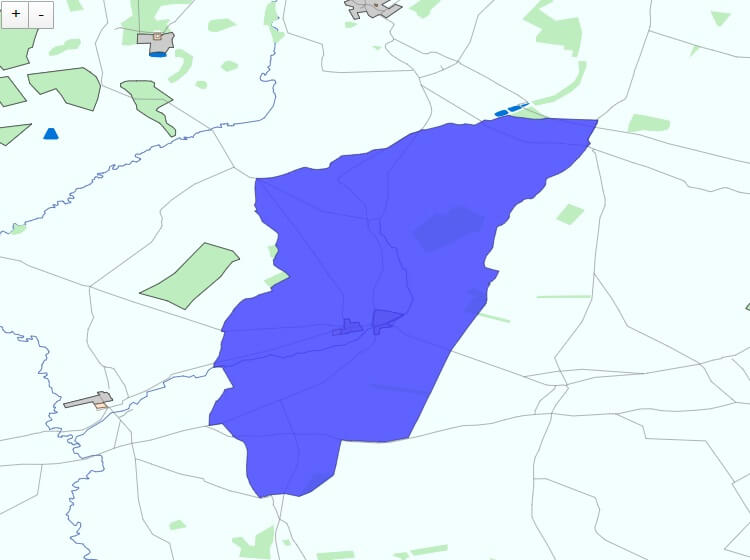
3.1.5 Display routes/paths or regions

Lines and curves (polyline features) drawn on a map represent roads, rivers, directions between places, or the observed path of a moving object. Shapes (polygon features) are used for political regions (country and municipal boundaries), building footprint outlines, and for contour lines which mark the extent of a certain value within continuous data (e.g., elevation). Polygons are also used for roads, rivers and so on at higher zoom levels, where the true shape of the feature can no longer be approximated as a single line.

D3 Geographies APIs example: Display routes/paths or regions.
Figure 5 D3 Geographies APIs example implementation of "Display routes/paths or regions".

See examples of displaying routes and regions as implemented by the reference JavaScript tools.

Issue 36: Use case: Display regions & routes discussion: use casestatus: editor's draft

Discuss this section on GitHub.

Required capabilities

3.1.6 Display custom web content describing map features

Map features often need additional content attached to them in order to provide context for the viewer. For example, with the most common mapping use case of displaying the various locations of an organization, additional content can display a location's opening hours or street address.

This use case is especially important for data visualization; a map can serve as a visual interface that allows a user to navigate map features and only show the information that they are interested in.

TomTom Maps SDK for Web example: Display custom content.
Figure 6 TomTom Maps SDK for Web example implementation of "Display custom web content describing map features".

See examples of displaying custom HTML annotations as implemented by the reference JavaScript tools.

Issue 37: Use case: Custom HTML annotations discussion: use casestatus: placeholder

Discuss this section on GitHub.

Required capabilities

3.1.7 Display map coverages or other custom tile data

Many mapping applications require custom imagery that goes beyond annotations of an existing map.

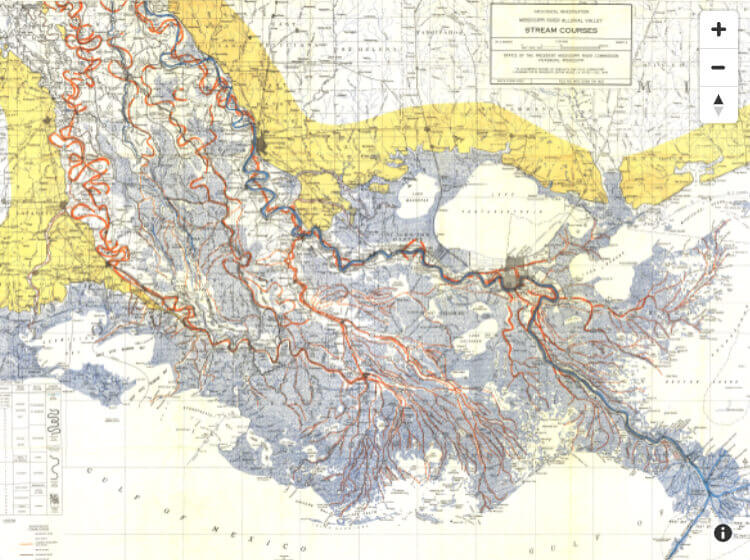
Unlike map features, which can be defined in geometric terms, map coverages define continuous variations, and are usually represented as raster image data. Many maps of natural features involve coverage data, such as maps showing terrain, vegetation cover, rainfall, or elevation. Raster image layers are also used for aerial and satellite photographs, and for pre-rendering vector feature data, on the server or in a specialized application. Custom map layers — in contrast to maps from major web map services — are necessary if displaying confidential business data, new research data, maps of proposed developments or historical geography, maps of non-Earth bodies such as Mars and the Moon, or any other type of map not included in the major wayfinding street maps.

When the custom map layer is of a limited scope, it can often be represented as a single image file. Single images are practical for static map views, and other cases where a broader spatial context is not as important, or when the author is trying to make a specific point about a set of data. Single image layers may also be rendered on the fly from a WMS.

To support slippy web maps with extensive pan and zoom capabilities, however, the custom images need to be divided into tilesets and the map viewer needs to be able to dynamically fetch the correct images.

MapBox GL example: Display custom imagery as a map layer.
Figure 7 MapBox GL example implementation of "Display custom imagery as a map layer".

See examples of specifying a data source for a map tile layer as implemented by the reference JavaScript tools.

Issue 38: Use Case: Map coverages or custom image tiles discussion: use casestatus: editor's draft

Discuss this section on GitHub.

Required capabilities

3.1.8 Combine multiple layers of map tile data or features

This is one of the fundamental use cases of web mapping. Because creating a complete tileset is such a large endeavor, almost all web maps use a pre-existing set of tiles from a provider, in combination with any number of layers consisting of data or features created by the map author.

See examples of multi-layer maps as implemented by the reference JavaScript tools.

Issue 11: Use case: Mashup multiple layers of map tile data or features in a map discussion: use casestatus: placeholder

Discuss this section on GitHub.

Required capabilities

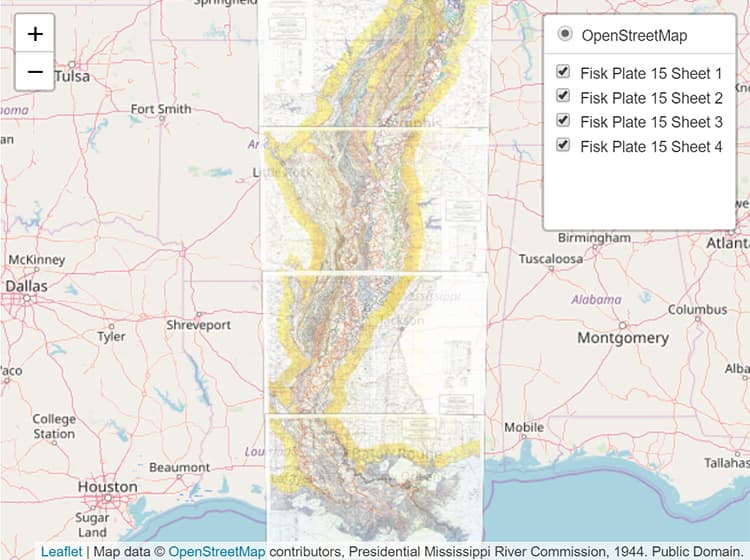
3.1.9 Provide alternative map layers which the user can select

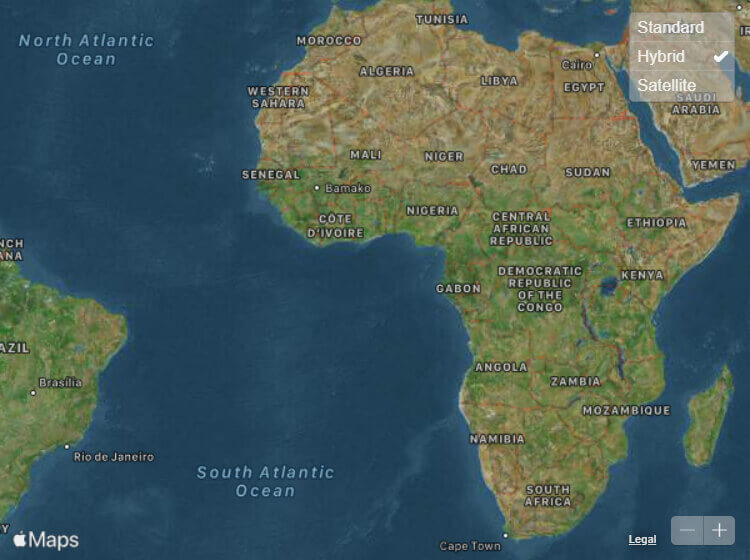
Different users may be interested in different aspects of a map (e.g., roads vs terrain), or may prefer different styles (e.g., light vs dark). When alternative maps are available, the website author needs a way to display the options to the end user, and easily swap them on the user's request.

Note: the ability to re-style the default map interface is also listed as a web-visitor use case. But alternative map layers are part of the content, as well.

MapKit JS (Apple Maps) API example: Provide alternative map layers which the user can select.
Figure 8 MapKit JS (Apple Maps) API example implementation of "Provide alternative map layers which the user can select".

See examples of allowing the user to select a different style for a map as implemented by the reference JavaScript tools.

Issue 81: Use Case: Provide alternative map layers which the user can select discussion: use casestatus: editor's draft

Discuss this section on GitHub.

Required capabilities

3.1.10 Display drawings or schematics without geographic coordinates

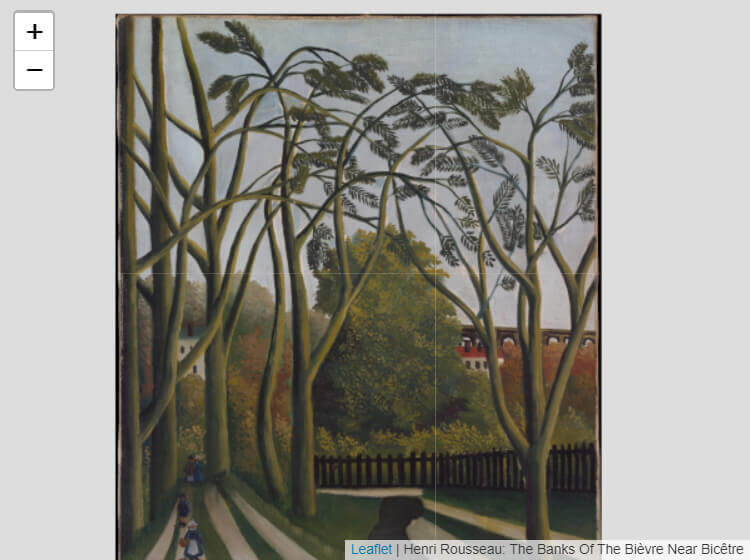
Many of the capabilities of a map viewer widget — panning and zooming, possibly with synchronized layers or dynamically loaded content for different positions or zoom layers — are useful for non-map content, or for maps that don't have geographic coordinates. Examples include technical schematics, blueprints, data charts, “mind maps” and other flow charts, or maps of fictional places. An author who is familiar with map widgets would want to reuse the same technology for displaying these types of map-like content.

Leaflet.js (with OpenStreetMap tiles) example: Non-geographic content in map viewers.
Figure 9 Leaflet.js (with OpenStreetMap tiles) example implementation of "Display drawings or schematics without geographic coordinates".

See examples of non-geographic content in map viewers as implemented by the reference JavaScript tools.

Issue 1: Use case: Technical drawings (panning, zooming, layers, etc.) discussion: use casestatus: editor's draft

Discuss this section on GitHub.

Required capabilities

3.1.11 Include animated spatial data in a layer

Issue 182: Use Case (content author): Include animated spatial data in a layer discussion: use casestatus: placeholder

Discuss this section on GitHub.

3.1.12 Require interaction before allowing pan/zoom (or opt-out of such potentially default behavior)

When a user hovers their mouse pointer – even if just briefly – over an in-page map viewer before wanting to continue scrolling the page (or panning the screen display on touch devices), map viewers are often panned or zoomed instead, as a result; the user is trapped from scrolling the web page as intended until moving the cursor (or finger) outside of the map viewer.

Google Maps example: Require interaction before allowing pan/zoom.
Figure 10 Google Maps example implementation of "Require interaction before allowing pan/zoom".
Issue 180: Use case (author / website visitor): Require interaction before allowing pan/zoom discussion: use casestatus: editor's draftsection: map viewer

Discuss this section on GitHub.

3.2 Website visitor use cases

3.2.1 Reposition or scale a map to find more context for the displayed locations

Users often want more information than is initially visible in a map viewer. The user may zoom out or pan, to help place the displayed location in a larger context. Or they may zoom in, to see details more clearly.

This use case exists regardless of how the user interacts with their device. For it to be fully supported, the map viewer must be explorable with all of the following input methods:

  • mouse/trackpad pointer (with or without a scroll wheel)
  • touchscreen gestures
  • standard/intuitive keyboard shortcuts
  • accessibility API events (e.g., as triggered by a screen reader or voice control software)

Test out panning and zooming on the basic single-location map views for the reference JavaScript tools.

Issue 39: Use case: User-controlled pan & zoom discussion: use casestatus: editor's draft

Discuss this section on GitHub.

Required capabilities

3.2.2 Reset the map to the initial view

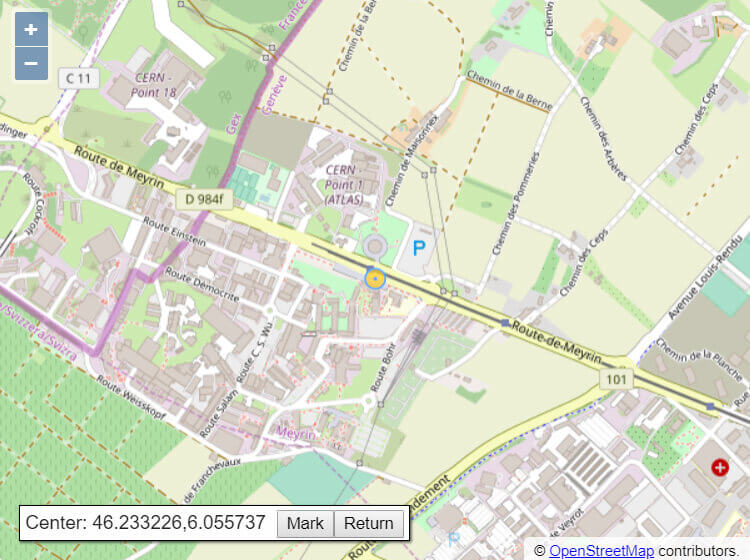
It is common for a map viewer to be provided in a web page to show an area relevant to the subject of the page. An encyclopedia might include a map on its page about a battlefield; a city guide might include a map on its page about the central railway station.

When a user interacts with the map, they may end up viewing a location far from the starting point, or with the map at a zoom level which is inconvenient for relating the map view to the primary content of the page.

In such a case it would be useful to provide a mechanism by which the user can reset the map to the original configuration provided by the web page author.

See examples of allowing a user to reset the map to their starting point as implemented by the reference JavaScript tools.

Issue 83: Use Case: Allow a user to reset the map to their starting point discussion: use casestatus: editor's draft

Discuss this section on GitHub.

Required capabilities

3.2.3 Rotate a map, or reset the bearing

When following directions on a map, many people find it easier if the map is oriented to the direction they are facing in real life. But rotating a map (intentionally or accidentally), can confuse orientation, too, so it is also useful to have an easy way to reset the map bearing (rotation) to the standard view: with the cardinal directions (North-South and East-West) aligned screen dimensions (top-bottom and left-right).

Test out map rotation on the basic single-location map views for the reference JavaScript tools.

Issue 114: Use case (website visitor): rotate/reset map bearing discussion: use casestatus: editor's draft

Discuss this section on GitHub.

Required capabilities

3.2.4 Access additional information about a point on the map

A map view can't show everything all at once. Users often want to find more information about the representations on the map. This information could be presented as details displayed on demand in a pop-up box or sidebar.

The details that are available might include the coordinates of the point, labels for any features at that point, metadata or links to further information about the features, or local data values for continuous coverage data layers.

Some of this information might require querying the server with the selected coordinates. But to the extent that the information is already available in the map viewer, it should be accessible by users without the author adding extra features.

Issue 21: Use case: Access additional information about a point on the map discussion: use casestatus: editor's draft

Discuss this section on GitHub.

3.2.5 Show/hide map layers or feature sets

A multi-layered map can be overwhelming. Users sometimes want to remove overlays or features that aren't relevant to them. In addition, comparisons between two maps (e.g., for before and after effects) can often be seen more clearly by toggling between two states within the same display.

See examples of allowing a user to show and hide overlays and features as implemented by the reference JavaScript tools.

Issue 115: Use case (website visitor): Show/hide map layers or feature sets discussion: use casestatus: editor's draft

Discuss this section on GitHub.

Required capabilities

3.2.6 Bookmark a location

Issue 41: Use Case: Bookmark/export a location discussion: use casestatus: placeholder

Discuss this section on GitHub.

Required capabilities

3.2.7 Search or sort within a set of geographic features

Issue 42: Use case: search within a set of map features discussion: use casestatus: placeholder

Discuss this section on GitHub.

3.2.8 Customize the color scheme (light/dark or high contrast)

Issue 43: Use case: View a map in dark mode or high-contrast mode discussion: use casestatus: placeholder

Discuss this section on GitHub.

3.2.9 View the current location on a map, without disclosing to the website

Issue 75: Use Case (website visitor): View your current location on the map, without sharing with the website discussion: use casestatus: placeholder

Discuss this section on GitHub.

3.2.10 View a map in fullscreen mode

To get a better view of a map, and to ease navigation, a user may want to view the map in fullscreen mode.

Issue 109: Use case (end-user): View a map in fullscreen mode discussion: use casestatus: editor's draft

Discuss this section on GitHub.

3.2.11 View a map as a Picture-In-Picture media object

Displaying a map viewer as a Picture-In-Picture (PIP) media object allows for users to navigate to other applications, or a different tab in the browser from which the map viewer is embedded, while still being able to see and interact with the map viewer.

Google Maps example: View a map as a Picture-In-Picture media object.
Figure 11 Theoretical Google Maps example implementation of "View a map as a Picture-In-Picture media object".
Issue 107: Use case (end-user): View a map as a Picture-In-Picture media object discussion: use casestatus: suggestion

Discuss this section on GitHub.

3.2.12 View a map in augmented reality

Issue 135: Use case (website visitor): View a map in Augmented Reality discussion: use casestatus: placeholder

Discuss this section on GitHub.

3.2.13 Save map content for offline use

Discuss this section on GitHub.

3.3 Application developer use cases

Built-in mapping widgets cannot cover all possible mapping applications. Web application developers need to be able extend and manipulate the viewer, or respond to user interaction with it.

Of course, a script-based mapping application will also usually need scripted control over basic map configuration. The necessary capabilities are listed above, under the relevant content author use cases. A web application author may also wish to implement capabilities for the benefit of the website visitor; again, the required capabilities are included in the visitor use cases.

3.3.1 Add a custom control to a map

A control is a user interface component that is integrated with a map. It may provide user feedback about the current state of the map, provide one or more affordances for manipulating the state of the map, or some combination of the two. Typically, controls are integrated into the map display in such a way that no other map content can overlie or obscure them.

Many client APIs allow developers to implement custom controls and add them to a map. The advantage of using a custom control is that it becomes a peer of the native controls provided by the map, and thus acquires any inherent capabilities and behaviours of those controls. For example, if a map provided a way for the user to hide all controls, the custom control would be hidden along with the native controls. This close integration cannot be achieved by a component which is external to the map, and only made to appear as if visually integrated through positioning, without additional work; furthermore, the integration may not be reliable in the long term if it must be achieved by relying on undocumented or underspecified behaviour of the map API.

A web developer may wish to add one or more custom controls to a map so as to provide capabilities that are not available within the standard set of controls provided by the mapping API, or to make up for perceived deficiencies of the provided controls.

For example, a default zoom control may be inaccessible to keyboard users, in which case it could be replaced with an accessible version that utilised a public API to effect zooming in response to the keyboard.

OpenLayers (with OpenStreetMap tiles) example: Add a custom control to a map.
Figure 12 OpenLayers (with OpenStreetMap tiles) example implementation of "Add a custom control to a map".

See examples of adding a custom control to a map as implemented by the reference JavaScript tools.

Issue 79: Use Case: Add a custom control to a map discussion: use casestatus: editor's draft

Discuss this section on GitHub.

Required capabilities

3.3.2 Provide feedback to a user as they manipulate the map

A web developer may wish to respond to changes such as position and zoom level of a map as it is manipulated by the user, in order to update user interface components containing information related to the map.

For example, an application displaying a list of places of interest in a city might update the list to highlight those places that are within the current extent of the map as the user pans and zooms, or filter the list to only show those items. On a device where the user's current location is known, the distance to the currently-displayed centre of the map, along with an indication of the user's bearing relative to that point, could be shown. If an application is showing a list of items whose associated locations are represented on the map by markers, selecting a marker could highlight the corresponding list item.

See examples of providing feedback to a user as they manipulate the map as implemented by the reference JavaScript tools.

Issue 80: Use Case: Provide feedback to a user as they manipulate the map discussion: use casestatus: editor's draft

Discuss this section on GitHub.

Required capabilities

3.3.3 Move a map to a new position and/or zoom level

Complex mapping applications often need to control the displayed map view, independently of the regular user-controlled panning and zooming. The developer's code must be able to move a map to a new position and/or zoom level.

For example, the user may be choosing from a list of locations of interest, and expect the map to adjust to show the current point of interest at the centre. If the items among which the user is choosing are not points but areas, such as administrative regions, then the map may need not only to move but also to adjust its zoom level to one which best fits the area.

See examples of moving a map to a new position and zoom level as implemented by the reference JavaScript tools.

Issue 116: Use case (developer): Set map position & zoom level discussion: use casestatus: editor's draft

Discuss this section on GitHub.

Required capabilities

3.3.4 Animate a map through a sequence of points

A web developer implementing the display of a number of locations arranged sequentially may require the ability to cause the map to animate through the locations by panning and zooming.

Examples include traversing through the points that make up a set of directions, or through a set of locations that form part of a temporal sequence.

See examples of animating a map through a sequence of points as implemented by the reference JavaScript tools.

Issue 117: Use case (developer): animate a transition to a new view/zoom discussion: use casestatus: editor's draft

Discuss this section on GitHub.

Required capabilities

3.3.5 Change the bearing of a map

In addition to user-controlled map rotation, a developer may need to dynamically update the bearing of a map — that is, to rotate the map view so that a direction other than North is at the "top".

Examples include responding to the orientation of a device, traversing a route, and allowing the user to orient themselves with respect to the map by manipulating it with respect to local landmarks.

See examples of changing the bearing of a map as implemented by the reference JavaScript tools.

Issue 84: Use Case: Change the bearing of a map discussion: use casestatus: editor's draft

Discuss this section on GitHub.

Required capabilities

3.3.6 Control which layers are currently visible & which can be hidden by the user

Leaflet.js (with OpenStreetMap tiles) example: Control which layers are currently visible & which can be hidden by the user.
Figure 13 Leaflet.js (with OpenStreetMap tiles) example implementation of "Control which layers are currently visible & which can be hidden by the user".

See examples of allowing the user to control the layer displayed by a map as implemented by the reference JavaScript tools.

Issue 82: Use Case: Control which layers are currently visible & which can be hidden by the user discussion: use casestatus: editor's draft

Discuss this section on GitHub.

Required capabilities

3.3.7 Generate new vector features from data

Many forms of geographical data are available in vector formats, such as shapefiles describing the boundaries of administrative areas and poly lines representing a route. A web developer wishing to display such external data requires an API allowing it to be added as an overlay to the map view.

Display routes/paths or regions covers the use of existing vector data, in standard geographic file formats. However, a web app developer may want to dynamically generate vector shapes from data. For example, to implement a feature allowing users to draw new shapes on the map, the developer needs to convert the selected points into a new polygon feature.

See examples of showing a vector data overlay as implemented by the reference JavaScript tools.

Issue 118: Use case (developer): Generate new vector features from data discussion: use casestatus: editor's draft

Discuss this section on GitHub.

Required capabilities

3.3.8 Generate a heatmap overlay from point intensity data

Heatmaps are a common way of showing the variation of some variable across a geographical area, as the accumulation of intensity created by many point measurements.

From the point of view of the end user, it is a type of coverage data that is displayed as an overlay on a map. However, many mapping frameworks have specialized APIs that can generate heatmap layers directly from the point data, without needing to pre-process it into a raster layer.

See examples of data heatmaps as implemented by the reference JavaScript tools.

Issue 119: Use case: Create heatmap layer from point data discussion: use casestatus: editor's draft

Discuss this section on GitHub.

Required capabilities

3.3.9 Enable drag & drop for map layers

Issue 106: Use case (developer): support drag & drop map layers discussion: use casestatus: placeholder

Discuss this section on GitHub.

4. Reviewed JavaScript Tools

Numerous options currently exist for a website author who wants to include a map viewer in a web page, with a minimum of custom code. The examples reviewed in this section are used to identify the common features (and limitations) of web map viewers.

Many major commercial providers of web map data tiles provide ready-to-use map viewer widgets for websites to use. In addition, multiple open source JavaScript libraries have developed to make it easier for website authors to build on other map data services.

Need data to back up the reference implementations.

The reviewed implementations come in three forms:

With these different structures, comparisons are not always exact. Similar functionality may be generated from very different APIs. We assess first whether a given capability is present in each implementation, and second whether there are common patterns in how that capability is exposed.

For each capability (potential web map feature) that we review, we assign one of the following implementation levels to each of the reference tools:

full support
The capability is implemented in a correct and comprehensive manner.
supported, with limitations
The feature is implemented, but there are notable limitations when assessing the implementation against our priorities.
partial support
Some parts of the feature are implemented.
no support
The capability could theoretically exist in the tool, but isn't included.
not applicable
The capability doesn't make sense for this tool, because of other aspects of its design.
Note

Compiling and serving map data is a complex, expensive enterprise. Many of the map data and search services require registered developer accounts, with usage-based pricing. This review focuses on features that are free-to-use for website creators, at least for low-traffic websites, or that use data which is available from many interchangeable sources. However, because of the complexities of pricing models used by some services, we don't strictly exclude paid features from our assessment of support.

4.1 Google Maps embeds and Google Maps Platform API

By far the most frequently used map widget on the web,[citation needed] Google Maps established many of the de facto standards in how a web map works.

Customized iframe embed URLs can be generated from the maps website (search/customize the view and then select "share"), or by constructing the URL query string yourself (a developer API key and account is required).

The Google Maps Platform includes a JavaScript API for generating map viewers and adding custom features and data layers. It also includes methods to access more complex search functions, local images, and other data. Most features require an API key and is billed by usage (page views or API requests).

Discuss this section on GitHub.

4.2 OpenStreetMap embeds

OpenStreetMap is a project to compile free-to-use wayfinding maps of the entire Earth, from crowdsourced contributions.

The interactive map on the group's website can be used to generate embeddable map widgets. Various options can also be specified in the URL for the embed source.

The image tiles created by the project can also be accessed directly by URL recipes, and these are used in other map viewer widgets and APIs. The raw data is also re-processed and used by other map data services.

Discuss this section on GitHub.

4.3 Bing Maps embeds and Bing Maps Control API

Bing maps provides embeds that can be generated from their website. For more complex options, the API can be used to generate widgets with minimal configuration, but also provides client-side APIs for manipulating the map, as well as an interface to Bing's search services. API tokens are required; free and paid plans are available, with usage caps.

4.4 MapKit JS (Apple Maps) API

MapKit JS provides a JS framework for integrating Apple Maps in a website, with a client-side API for customizing interactions, and integrations with Apple search services.

A developer account is required, along with a method of generating encrypted API tokens on demand on the webserver.

Discuss this section on GitHub.

4.5 Mapbox GL JS API and Mapbox Studio embeds

Mapbox provides map data as a service, as well as frameworks for multiple platforms. The GL JS framework generates map viewer widgets from client-side JavaScript calls, using WebGL for the actual rendering. Alternatively, the Mapbox Maps API returns complete HTML slippy maps based on URL configuration, and so can be used as an iframe source. These maps can be configured through Mapbox Studio, a graphical interface for building and styling maps. Each custom map is then assigned an ID, which can be passed into to the slippy map URL in order to fetch the map.

An API key is required, with cost based on usage.

Discuss this section on GitHub.

4.6 Leaflet.js API

Leaflet is a popular open-source JavaScript framework for building customized map views. It doesn't currently have a declarative API, but widgets similar to map embeds can be generated with a few calls to the library methods.

Leaflet isn't associated with any particular map data source. It can use image tiles from most web map (tile) services.

4.7 OpenLayers API

OpenLayers is one of the most established open-source libraries for creating dynamic web maps from map data in standard formats. As with Leaflet, it isn't associated with any particular map service. A basic slippy map can be created with a few lines of custom JavaScript.

Discuss this section on GitHub.

4.8 TomTom Maps SDK for Web

TomTom is a provider of geographic search and routing services and street map imagery. They provide software development kits (SDK) for mobile and web use, although their map tile and image APIs can also be used with other web map frameworks or GIS viewers. The viewer used by the web SDK is a customized wrapper around Leaflet.

TomTom's street map imagery is available as raster tiles, custom-generated raster images for specified bounds, or as vector tiles (using Mapbox's vector tile specification). The example pages use the vector data source.

Access to TomTom's map data and search APIs requires an account and API key; there is a daily quota of free transactions.

4.9 D3 Geographies APIs

The data visualization library D3 includes the d3-geo module which defines methods for manipulating vector map data (which the website author must provide). Unlike the other JS tools being reviewed here, D3 does not include code for a ready-made map viewer widget, but it is used for custom client-side mapping applications.

5. Map Viewer Widget Capabilities

The map viewer widget is the interactive component that displays a map to end users. The map might be the primary purpose of a website, or a small embedded element in a larger HTML page.

For this section of the review, we focus only on aspects of the map viewer that are generated by the map widget framework based on initial configuration and data by the website developers. In other words, these are the features that could be represented by elements and attributes in a native HTML solution. The next section, on client-side APIs, covers custom JavaScript manipulation and event handling for the map view.

We also skip over the technical details of how the map data is encoded, and assume the browser can convert the map data into images on screen. The potential requirements in this section describe ways in which map viewers enhance the normal experience of viewing a static image (e.g., img element) in a web page. § 7. Map Data Formats for Map Viewers explores data structures and file formats.

5.1 Rendering base layers

5.1.1 Embed an interactive map viewer, using HTML markup

This is the basic capability that is currently missing from the web: the ability to use HTML code alone to add a map to a web page.

Issue 137: Capability: Embed an interactive map viewer, using HTML markup discussion: capabilitystatus: editor's draftsection: map viewer

Discuss this section on GitHub.

Existing implementations

There are two types of web map implementations that currently come close: embeddable iframe maps, and HTML custom element wrappers to JS mapping libraries. The limitation of iframes is that all configuration must be contained in the source URL, instead of being able to use a proper markup API of attributes and child elements. The limitation of custom elements, currently, is that they require extra polyfill JavaScript in addition to the mapping library JavaScript.

short-name-embed
short-name-api
full support|supported, with limitations|partial support|no support|not applicable: TO DO
Supported use cases
Uses beyond mapping

TO DO: include img/picture, video, ...?

Conclusion

This functionality is the base requirement for a native HTML web map feature. Being able to define a basic map using markup would be one of the key benefit of having a built-in feature, compared to existing options.

5.1.2 Generate a default map for a given area

Often, the website author does not want to specify the map data source or other details about the map; they just want a generic wayfinding map of the area.

Discuss this section on GitHub.

Existing implementations

The embeds and commercial APIs all provide default street maps without the author needing to specify the map source. In contrast, the more flexible APIs must be combined with a separate map provider (e.g., OpenStreetMap).

google-maps-embed
google-maps-api
openstreetmap-embed
bing-maps-embed
mapbox-embed
tomtom-sdk
bing-maps-api
apple-mapkit-js-api
full support: this is the basic function for these widgets: give it a location, it will draw the map.
leaflet-api
open-layers-api
no support: must be combined with a separate map provider.
Supported use cases
Uses beyond mapping

No non-map uses for generating a default street map. But, there may be interest in displaying default maps as static images in addition to using them within map widgets.

Conclusion

This functionality is a highly valuable enhancement for native web maps, especially if it could be built on native platform features that allow the users to download maps in advance for later use. However, if user agents cannot integrate with a native operating system feature, they would need to rely on a third-party service for the map data.

  • Author experience: simple defaults Many map services are either paid or require some form of authentication, even for simple use cases such as this. Having this capability be a browser feature reduces complexity for most use cases.
  • Author maintainability: removes dependencies on third-party services The vast majority of web maps currently utilize either third-party mapping libraries or third party tiles. Web maps that self-host both library code and tiles avoid third-party dependencies, but due to the resources required to self-host tilesets, only a small percentage of map authors opt for this approach.

5.1.3 Display an image file as a map layer

If a web author already has (or can generate on the server) a map in a standard image format the browser can render — JPEG, PNG, SVG, etc. — can the map viewer display it as a map layer? Or will it need to be converted into a geospatial data format?

For most use cases, at least some additional metadata will be required, to align the image pixels to the geographic coordinates of the map.

Issue 138: Capability: Display an image file as a map layer discussion: capabilitystatus: editor's draftsection: map viewer

Discuss this section on GitHub.

Existing implementations

The majority of the embed maps do not support custom image layers. The API tools that do support this feature typically accept a layer source, attribution, and the coordinate system to be used by the image layers, which can be mapped to pixel units for more simple use cases.

google-maps-api
leaflet-api
open-layers-api
tomtom-sdk
bing-maps-api
apple-mapkit-js-api
full support
mapbox-embed
google-maps-embed
openstreetmap-embed
bing-maps-embed
no support: most embeds do not support this. Adding a custom image layer requires more configuration than supported by these tools.
Supported use cases
Uses beyond mapping

This capability is essential in order to provide support for non-map materials. The ability to display non-georeferenced media like technical drawings, schematics or archival material within a standardized viewer has a wide variety of practical use cases.

The SVG image element provides an example of external image content being rendered into a specified rectangle within a coordinate system.

Similarly, the HTML Canvas2D API has a drawImage() method for rendering a scaled and positioned copy of an external image within the canvas.

Conclusion

5.1.4 Display a map using tile data from an author-specified web map service

A single image for an entire map layer is impractical on the web for large, pan-able maps at good resolution. For this reason, most web map services provide map data as tilesets. Beyond any default map layer that the viewer provides, can it process tilesets as a custom map layer? If so, in what form?

Issue 139: Capability: Display a map using tile data from an author-specified web map service discussion: capabilitystatus: editor's draftsection: map viewer

Discuss this section on GitHub.

Existing implementations

All API tools support some form of this feature, whether it be in the more popular OpenStreetMap standard (often called XYZ), or the WMTS standard. For most services, tiles can be accessed through a URL with the X, Y and Z parameters defined, where X and Y represent the tile coordinates (not to be confused with latitude and longitude), and Z represents the zoom level. One thing to note is that while Google Maps and the OpenStreetMap standard both count tiles from the upper left corner of the map, the WMTS standard has the Y axis inverted, counting tiles from the bottom left, and some transformation may be needed when using certain tools with certain tilesets.

google-maps-api
mapbox-embed
leaflet-api
open-layers-api
bing-maps-api
apple-mapkit-js-api
full support
tomtom-sdk
no support: Although TomTom supports WMS services (where the server can generate a single image file for custom map coordinates), it does not support WMTS or other custom tile sources
google-maps-embed
openstreetmap-embed
bing-maps-embed
no support
Supported use cases
Uses beyond mapping

Conclusion

  • This capability is necessary for many advanced use cases.

5.1.5 Display a basic map without JavaScript

Users may disable JavaScript for security reasons, or as part of a strategy to reduce data consumption. In addition, JavaScript can fail because of network errors or because of a parsing or runtime error in the code.

It is reasonable that web maps have reduced functionality without JavaScript. But ideally, a basic map with text annotations and links should still work without it.

A natively-supported, declarative web map viewer would by definition have this capability.

Discuss this section on GitHub.

Existing implementations

Our reference implementations are primarily JavaScript tools. Many do not — by default — provide any features when JS is disabled or fails, although a website author could build in fallbacks by including links, images, or iframes in the markup that are replaced when the script runs.

For built-in graceful degradation, iframe embeds potentially offer the best experience, but all of the reference tools do not support this by default, the map author must add this feature themselves.

google-maps-api
google-maps-embed
bing-maps-embed
mapbox-embed
tomtom-sdk
bing-maps-api
apple-mapkit-js-api
supported, with limitations: these tools offer options to serve a static image without JavaScript, typically by joining together tiles when the map author passes in a center and zoom level parameter into a specific URL format. However, this is not the default fallback behavior for the embeds when JavaScript is turned off; adding a fallback image must be implemented as a custom feature.
openstreetmap-embed
leaflet-api
open-layers-api
no support:
Supported use cases
Uses beyond mapping

To the extent that any capabilities of a map viewer are shared with other content, having that capability work without JavaScript is a shared benefit.

Conclusion

Based on the limited data, we are undecided about whether this should be a requirement.

  • Author experience: simple defaults As no tools include this by default, supporting this capability would dramatically simplify the process of building progressively enhanced maps.
  • Performance: data savings Supporting fallbacks for devices without JavaScript would allow users on poor connections or those who intentionally disable JavaScript to have a decent baseline experience.
  • Consistency: progressive enhancement This capability is fundamental to building progressively enhanced maps.

5.1.6 Display map content in a users preferred language

Issue 136: Capability: Display map content in a users preferred language discussion: capabilitystatus: placeholdersection: map viewer

Discuss this section on GitHub.

5.2 Vector features and overlays

5.2.1 Show pinpoint locations or custom markers on the map

A map marker is a small icon that marks a point feature. Wayfinding maps often have extensive sets of icon markers that identify different types of features. In web maps, the pinpoint marker (a circle narrowing into a point at the bottom) has become standard for identifying any location of interest.

Issue 140: Capability: Show pinpoint locations or custom markers on the map discussion: capabilitystatus: editor's draftsection: map viewer

Discuss this section on GitHub.

Existing implementations

Almost all of the reference tools support map markers in some way. While most embed tools include some kind of geocoder in order to support address lookup, the tools typically utilize latitude and longitude coordinates under the hood, and map authors can pass in the coordinates to the URL or configuration object upon initialization.

The notable standout here is the Google Maps Embed. Searching for a location by address will return information for a 'Place', each with its own ID and information such as business hours, reviews, and etc. The ID, rather than latitude and longitude, is passed into the iframe URL in order to bring up the additional location information for that particular place.

google-maps-embed
google-maps-api
mapbox-embed
leaflet-api
open-layers-api
tomtom-sdk
bing-maps-api
apple-mapkit-js-api
full support: allows multiple user-specified pinpoint locations to be placed
openstreetmap-embed
supported, with limitations: only allows you to show a single marker on embedded maps
bing-maps-embed
no support: allows for display of a general area but no map markers
Supported use cases
Uses beyond mapping

If the map element were to support non-georeferenced images, custom markers could be used as an annotation tool for technical drawings and other similar media.

SVG contains a number of elements that are positioned on a coordinate system. The coordinates and dimensions of the element are defined in markup, as attributes on the element.

The HTML Canvas2D API also offers the ability to draw points on a coordinate system, but images are drawn by passing coordinates into a JavaScript method, instead of an element such as in SVG. This method of drawing features is more similar to existing mapping libraries, which are also reliant on JavaScript. However, the Canvas API offers a very low level of abstraction in comparison to mapping libraries. Depending on the complexity of the marker, the code to draw it may be very verbose.

Conclusion

This functionality is a requirement for modern web maps.

5.2.2 Draw polygons or polylines as stylable, interactive vector graphics (separate from the image tiles)

Polygons and polylines are two of the most common types of map data features.

It is common on the web for vector map data to be pre-rendered into raster image layers on the server. However, if the vector feature is important for the web view, drawing it as separate graphic object means it can be dynamically styled, associated with labels or descriptions, and the target of user events.

Issue 141: Capability: Draw polygons or polylines as stylable, interactive vector graphics (separate from the image tiles) discussion: capabilitystatus: editor's draftsection: map viewer

Discuss this section on GitHub.

Existing implementations

The tools that support this capability primarily fall under the API category. All of the API tools support the drawing of lines and polygons by passing in coordinates into a JavaScript function. Mapbox differs from the other implementations as it only accepts files in the GeoJSON format. The embed tools lack support for this capability.

google-maps-api
mapbox-embed
leaflet-api
open-layers-api
tomtom-sdk
bing-maps-api
apple-mapkit-js-api
full support: polygons and polylines can be added and have styling applied to them.
google-maps-embed
openstreetmap-embed
bing-maps-embed
no support:
Supported use cases
Uses beyond mapping

SVG contains both a polyline and a polygon element. A comma separated list of coordinates is assigned to the points attribute to generate the shape.

The way that polylines and polygons are created in the HTML Canvas2D API is much more manual, requiring a sequence of calls to the moveTo and lineTo methods. Like other aspects of the Canvas API, this syntax can be quite verbose.

TODO: Mention HTML area and CSS polygon() function.

TODO: describe how polyline/polygon are represented in the important geospatial specs.

Conclusion

Based on the limited data, we are undecided about whether this should be a requirement.

Map data is subject to copyright, and use of the maps on the web usually requires at least attribution, and maybe links to terms of use. Many map services also include links for end users to report errors.

Issue 143: Capability: Display map data attribution and links discussion: capabilitystatus: editor's draftsection: map viewer

Discuss this section on GitHub.

Existing implementations

Standard practice in the reviewed web map tools is to display this attribution in the lower right of the map widget. For map viewers that provide their own map data, the links and copyright is automatically generated. For map frameworks that allow the developer to specify the map data source, these "attribution control" values can be set in configuration.

google-maps-embed
openstreetmap-embed
bing-maps-embed
google-maps-api
leaflet-api
open-layers-api
bing-maps-api
apple-mapkit-js-api
full support: (as described above)
mapbox-embed
tomtom-sdk
supported, with limitations: attribution is automatically generated, but it is not keyboard accessible.
Supported use cases
    Uses beyond mapping

    Website authors can use Microdata and other related formats to provide attribution data in a standardized format. How and whether or not this content is displayed is up to the website author, but the goal is to provide a machine-readable format for important document content.

    The cite element is for describing references to a cited creative work. The HTML blockquote and q elements have a cite attribute where you can pass a URL as the source of a quote, but browsers currently do not display this information to the end user.

    5.3 Interpreting locations & map positions

    5.3.1 Select map view from latitude and longitude point

    Latitude and longitude defines a point on the Earth's surface, without requiring any further information. For website content, latitude and longitude data might come from photo or video metadata (from GPS-enabled cameras), or it might be calculated by the author using map search services. In a dynamic web app, latitude and longitude might be generated from geolocation on the user's device.

    Issue 144: Capability: Select map view from latitude and longitude point discussion: capabilitystatus: editor's draftsection: map viewer

    Discuss this section on GitHub.

    Existing implementations

    All the reference tools allow the website author to display a specific location, defined by latitude and longitude, from a map tile set.

    google-maps-api
    openstreetmap-embed
    leaflet-api
    mapbox-embed
    tomtom-sdk
    bing-maps-api
    apple-mapkit-js-api
    full support: setting a location by latitude and longitude is straightforward.
    open-layers-api
    supported, with limitations: A location defined with longitude and latitude must be converted to the map tile coordinate system, but the API provides the conversion function.
    bing-maps-embed
    partial support: does not support markers for a single location, but it is possible to display a map centered around a particular latitude and longitude point with no marker
    Supported use cases

    The Geolocation API and Geolocation Sensor API expose the user's location using latitude and longitude data. It should be possible to set the view on a web map using data returned from these APIs. Both of these APIs use the National Imagery and Mapping Agency Technical Report 8350.2, Third Edition as the technical definition of longitude and latitude (consistent with most modern geospatial standards), and a web map standard should use the same definition. [geolocation-API][geolocation-sensor][WGS84]

    Conclusion

    This functionality is a requirement for modern web maps.

    5.3.2 Select map view from street address or place name

    For many mapping use cases, a website author won't have exact latitude and longitude values pre-calculated. They'll have street addresses or place names in a human-readable, localized format. To convert these addresses or names into a point on a web map, the web mapping service needs access to a Gazetteer search and corresponding databases.

    Issue 145: Capability: Select map view from street address or place name discussion: capabilitystatus: editor's draftsection: map viewer

    Discuss this section on GitHub.

    Existing implementations

    The majority of reference tools support this functionality, either through first party support or through popular plugins. This frequently takes the form of a search form that returns a possible list of options that the map author can select from. The Google Maps geocoder is the gold standard amongst these implementations, as it is more forgiving in terms of search format and provides better support for different localizations than other alternatives.

    google-maps-embed
    google-maps-api
    openstreetmap-embed
    mapbox-embed
    tomtom-sdk
    bing-maps-api
    apple-mapkit-js-api
    full support: by default, these tools provide address search when setting up the map
    leaflet-api
    open-layers-api
    supported, with limitations: the default libraries do not support this but there are a wide variety of geocoding plugins that support this capability.
    bing-maps-embed
    partial support: does not support markers for a single location, but it is possible to display a map centered around a particular street address with no marker
    Uses beyond mapping

    There are many cases where a website may expect an address from a user. An input type specifically for addresses has a wide variety applications other than displaying a map, such as reducing user error when facilitating e-commerce and delivery services.

    Both the autocomplete attribute on HTML form controls and the Payment Request Payment Address Interface represent existing attempts to standardize what an address is. It is noteable that between these two implementations, there are differences in the way that various fields are named, and further research would be needed to determine the best path forward.

    Conclusion

    Based on the limited data, we are undecided about whether this should be a requirement.

    • Internationalization: difficult to do well There are significant regional differences when it comes to how addresses are formatted. A good implementation of this would need to take these regional variations into account.
    • Privacy: involves personal data It is unlikely that this capability could be supported in a fully client-side way, the inputted address may be revealed to the browser or website author.

    5.3.3 Display map tiles defined in various common coordinate systems

    Most tiled image maps on the web use the Web Mercator system of dividing map data into image tiles. As the name suggests, this is based on the Mercator map projection, with the addition of standard for dividing the map into tiles at different zoom levels.

    Web Mercator is not appropriate for maps of polar regions, where the Mercator projection distorts geography. Other tileset coordinate systems have been defined specifically for polar maps. In addition, many regions have well-established local map grid coordinate systems, and being able to use the local grid means access to established map data sources.

    The technological complexity of supporting different projections depends on how many other capabilities are supported. Tiling images doesn't require knowing how those images map to geographic coordinates. But the tile boundaries and coordinate projection are needed in order to draw marker points or vector features over the map. And information about the tileset zoom levels is required in order to dynamically load content on pan and zoom.

    Combining map layers with different projections, or otherwise converting one map projection to another view, is a separate capability, discussed in § 5.3.4 Reproject map tile data into a new projection or globe view.

    Issue 14: Capability: Display map tiles defined in various common coordinate systems discussion: capabilitystatus: editor's draftsection: map viewer

    Discuss this section on GitHub.

    Existing implementations

    With the Google Maps API, you are able to create custom rectilinear projections, by passing in a bi-directional mapping between coordinate systems. Leaflet.js supports the Equirectangular, Elliptical Mercator and Web Mercator projections by default, and you can use the external plugin Proj4Leaflet to support other projections. OpenLayers also relies on Proj4 in order to support other projections.

    google-maps-api
    leaflet-api
    open-layers-api
    supported, with limitations: (as described above)
    google-maps-embed
    openstreetmap-embed
    bing-maps-embed
    mapbox-embed
    tomtom-sdk
    bing-maps-api
    apple-mapkit-js-api
    no support: these embeds only support the Web Mercator projection.
    Supported use cases
    Uses beyond mapping

    Support for this capability would allow for non-georeferenced maps to be displayed, such as maps of non-earth planets and fictional spaces.

    This capability would also provide support for the visualizing anything that exists in a Euclidean coordinate system, such as charts that follow a cartesian coordinate system or spherical coordinate systems, including diagrams for a variety of engineering, scientific and medical purposes.

    The Geolocation API already provides a standard interface for latitude and longitude coordinates under the WGS94 system, but currently no other reference systems are supported.

    Conclusion

    Based on the limited data, we are undecided about whether this should be a requirement.

    5.3.4 Reproject map tile data into a new projection or globe view

    Map image tiles are usually defined in Web Mercator or other grid-based tile systems. For large scale maps (of the globe or continents), these reveal distortions created by the underlying projections. Many different map projections exist to more fairly display the relative size and shapes of continents on a flat map. In addition, within an interactive web environment, it is possible to use projections which more directly represent the 3D globe without trying to display it all at once, letting user interaction rotate it to show parts of interest.

    Issue 3: Capability: Reproject map tile data into a new projection or globe view discussion: capabilitystatus: placeholdersection: map viewer

    Discuss this section on GitHub.

    Existing implementations

    None of the reference tools support this feature. For the tools that support alternative projections, it is possible to to work around this by reinitializing the map in a different projection.

    google-maps-embed
    openstreetmap-embed
    bing-maps-embed
    mapbox-embed
    leaflet-api
    open-layers-api
    tomtom-sdk
    bing-maps-api
    apple-mapkit-js-api
    no support:
    Supported use cases
      Uses beyond mapping

      The number of related specifications that deal with spatial transformation in some way suggest that there is a desire for the ability to utilize things like general mesh transformations. Adding support for reprojection in a map capacity may have the added benefit of providing a foundation for general graphical and text transformation.

      There are many existing web specifications which support the transformation of graphics to some extent. The best example is the feDisplacementMapElement filter. Originally designed for SVG, it can be used to spatially displace an image on the fly. Also from SVG is the TextPathElement, where text can be rendered along an arbitrary, author-specified path.

      The CSS transforms specification offers a simple way to transform elements, ranging from simple 2D transforms such as 'skew' to composite transformations in a 3D space.

      In terms of 3D examples, WebGL is an example of a web specification where projecting a flat image or 3D texture onto a curved or spherical surface is possible. WebGL is already used in some cases for interactive reprojection for non-map use cases.

      Conclusion

      Based on the limited data, we are undecided about whether this should be a requirement.

      5.3.5 Save the location or export to other application

      For the user, it is often useful to bookmark or save a location from a map, separate from the website which included it. The user may want to export the location to a GPS or native mapping application so they can calculate directions to it.

      Issue 146: Capability: Save the location or export to other application discussion: capabilitystatus: editor's draftsection: map viewer

      Discuss this section on GitHub.

      Existing implementations

      Most of the reference tools do not support this capability. Of the tested tools, only OpenStreetMap offers the option to export a map location in a standard format.

      openstreetmap-embed
      full support: in addition to being able to generate and share a link or a map embed, it is possible to export the point locations as a geo URI.
      google-maps-embed
      supported, with limitations: a user is able to generate a link to the map that can be shared via a variety of methods, but there is no way to easily send this information to another application.
      bing-maps-embed
      mapbox-embed
      leaflet-api
      open-layers-api
      tomtom-sdk
      bing-maps-api
      apple-mapkit-js-api
      no support:
      Supported use cases
      Uses beyond mapping

      The Web Share API is a specification that is designed for sharing links and other content to a destination of the user's choice. The API was designed to be extended to allow for sharing new types of data via adding new members to the ShareData dictionary.

      Though not exclusively a web specification, the Geo URI scheme represents a standard way to represent locations within a given coordinate reference system. However, it is important to note that Geo URI is considered to be a location estimate, not an exact location.

      The WICG Text Fragment specification is an example that builds upon the existing use of URL fragments in order to allow direct linking to a specific portion of text within a page. In order to not conflict with the existing URL fragment, this specification introduces a fragment directive delimiter string (":~:") to indicate that the fragment is a text fragment.

      5.4 User navigation (pan & zoom)

      5.4.1 Zoom the map independently from the rest of the page

      In addition to panning the view, it is standard to allow the user to adjust the map scale: zooming in to increase magnification (show finer detail), zooming out to decrease magnification (show a wider area).

      Issue 147: Capability: Zoom the map independently from the rest of the page discussion: capabilitystatus: editor's draftsection: map viewer

      Discuss this section on GitHub.

      Existing implementations

      The following UI is standard across the reviewed map widgets:

      • Accessible buttons labelled with plus (+) and minus (-) signs zoom by steps.
      • Mouse wheel movements (usually used to scroll the page) are captured and converted into continuous zoom adjustments (mouse scroll down becomes zoom out, mouse scroll up becomes zoom in). Apple Mapkit JS inverts this popular convention. Modifier keys (such as Ctrl for Google Maps and Shift for Apple Mapkit JS) may be required so as not to intefere with default scroll behavior.
      • Touch gestures for pinch zoom are used to zoom the map instead of the page.
      google-maps-embed
      google-maps-api
      openstreetmap-embed
      leaflet-api
      open-layers-api
      tomtom-sdk
      bing-maps-api
      apple-mapkit-js-api
      full support: (as described above)
      mapbox-embed
      supported, with limitations: all of the above is supported, but the buttons do not have any focus styles
      Supported use cases
        Uses beyond mapping

        Localized zooming is used on the web for charts and diagrams, photographs (e.g., to examine details in a product photo, or for photo editing apps), embedded documents (e.g., a PDF viewer), and sometimes data tables.

        Zooms are often implemented using transforms, which defines the scale as a multiplicative factor compared to the normal size (scale(2) for doubling the size, zooming in; scale(0.5) to zoom out by the same amount). Scale transforms are paired with translations to create zoom and pan effects. [css-transforms-1]

        An alternative approach for describing zoom and pan is used in SVG viewBox attribute and in spatial media fragments. In this system, the container element defines its own width and height (e.g., with CSS) plus a target rectangle in the zoomable graphic's coordinate system (x and y offset, plus width and height); the user agent then zooms and pans the graphic to display the target rectangle in the available space. [SVG2][media-frags]

        Conclusion

        This functionality is a requirement for modern web maps, with other uses in the web platform. A zoom specification will need to carefully consider all uses so it can be implemented consistently, and should be coordinated with panning.

        • To Do

        5.4.2 Pan the map display

        A key part of the interactivity of a web map widget is that the user can change the region displayed. To pan the map is to shift the view horizontally or vertically, so a different location is centered in the map display.

        For mapping, panning is tightly linked with zooming and with dynamic loading of new content. For this discussion, we've divided them into separate features so that the costs, benefits, and non-mapping use cases can be assessed separately.

        Discuss this section on GitHub.

        Existing implementations

        The following UI is standard among the reviewed map viewers:

        • Drag the map view by clicking and holding a mouse.
        • Swipe the map view with touch gestures.

        The following UI is available in some viewers, but not all:

        • Pan the map view with arrow keys.

        Many of the maps lack a visible indication of keyboard focus for panning, and do not provide any other affordances to indicate how keyboard panning should work.

        open-layers-api
        bing-maps-api
        full support: for OpenLayers, a tabindex value must be added to the map container, but keyboard panning events are included natively
        openstreetmap-embed
        mapbox-embed
        leaflet-api
        tomtom-sdk
        supported, with limitations: Mouse, touch, and keyboard panning are supported; no keyboard focus indication
        google-maps-embed
        google-maps-api
        apple-mapkit-js-api
        partial support: Mouse and touch panning only. Keyboard panning is possible on the google maps web application. Keyboard panning is activated when a specific region of the map is focused.
        Supported use cases
          Uses beyond mapping

          The standard panning interactions are also common on the web for other JS-enhanced zoom and pan graphics (e.g., a close up of a product photograph, a data chart). Similar interactions may be used in some games, or in navigation of large spreadsheets. Creating a native way to trigger panning within a web layout could help ensure consistent, accessible user experiences for panning.

          From a rendering perspective, panning a map is very similar to scrolling a section of a CSS layout. Important differences:

          • Although 2D scrolling is supported, the interaction usually emphasizes a primary reading axis. Panning is usually 2D, and may be conceptually diagonal as often as horizontal or vertical.
          • The initial scroller view is usually at the start of the content (and “start” has meaning); an initially panning view is often in the middle, with panning in all directions possible.
          • Scrollable content is often visually indicated by scrollbars (although it is now common to hide scrollbars until use).
          • The user interactions are different for some input methods: mouse panning uses click and drag instead of mouse wheel for (primary-direction) scroll, keyboard panning only uses the arrows, not the space bar and page up/down keys (which trigger scroll in the primary axis).

          Panning interactions also overlap with the proposed CSS spatial navigation spec. [css-nav-1]

          In web maps and many other applications, panning effects are combined with zoom effects; for that reason, panning is often implemented using CSS transforms or SVG viewBox, which can also handle zoom. [css-transforms-1][SVG2]

          Conclusion

          Panning the map is universally supported in JS web maps, and is therefore a requirement for native web maps. The relevant specification should be coordinated with CSS, considering other use cases for panning on the web. Thought is needed on how to make panning accessible to all users.

          5.4.3 Load additional map tiles when they pan into view

          For web maps using a tileset, an initial series of tiles is loaded based on the current position of the map. Tiles are lazily loaded, and as such additional ones are loaded when they are panned into view. This allows for a smaller initial payload and improved performance.

          This capability is closely tied to the previous capability, panning the map display.

          Issue 149: Capability: Load additional map tiles when they pan into view discussion: capabilitystatus: editor's draftsection: map viewer

          Discuss this section on GitHub.

          Existing implementations

          All of the reference tools support this capability as described. Most tools show gray placeholder tiles while the additional tiles are being loaded, but Google Maps shows a placeholder that is representative of the tile to be loaded (ie. a blue tile for ocean tiles). Bing maps takes a similar approach and shows a very low resolution tile, until new tiles are fetched.

          google-maps-embed
          google-maps-api
          openstreetmap-embed
          bing-maps-embed
          leaflet-api
          open-layers-api
          tomtom-sdk
          bing-maps-api
          apple-mapkit-js-api
          full support:
          Uses beyond mapping

          Dynamic loading of additional data is a common feature request for SVG charts and diagrams. Because the initial performance impact of loading and rendering large amounts of data can be quite significant, native web features that deal with the management of data have potentially wide-reaching performance benefits.

          Image lazy loading is an example of a feature in the native web platform that benefits performance. This attribute is extremely simple for developers to implement and offloads the complexity of deciding when to load the image onto the browser.

          5.4.4 Wrap/duplicate data tiles when panning around the globe

          A web map is not subject to the same limitations of printed maps and can be panned infinitely along an axis. Tiles should be wrapped along at least one axis in order to create a seamless panning experience.

          Issue 150: Capability: Wrap/duplicate data tiles when panning around the globe discussion: capabilitystatus: editor's draftsection: map viewer

          Discuss this section on GitHub.

          Existing implementations

          All of the reference tools support this capability. Google Maps and Bing Maps cache the tiles once they are loaded, but Leaflet, Open Street Map and the Open Layers API re-fetch the same tiles as the user pans across the map.

          google-maps-embed
          google-maps-api
          openstreetmap-embed
          bing-maps-embed
          mapbox-embed
          leaflet-api
          open-layers-api
          tomtom-sdk
          bing-maps-api
          apple-mapkit-js-api
          full support: (as describe above)
          Uses beyond mapping

          Some UI patterns commonly found on the web, such as carousels and marquees, utilize a similar kind of wrapping logic. Since the marquee element was declared obsolete, there is no way to incorporate wrapping/looping functionality natively, so incorporating this feature into web maps may have other potential benefits.

          5.4.5 Maintain reasonable scale of labels and lines when zooming

          Zooming a map widget is different from magnifying a regular image, or adjusting the overall browser zoom level; the layout is magnified, but annotations such as text size and stroke width are not.

          It should be noted that the Web Content Accessibility Guidelines Success Criterion 1.4.4 requires that all text be zoomable indepedent of the content by up to 200%.

          Issue 151: Capability: Maintain reasonable scale of labels and lines when zooming discussion: capabilitystatus: editor's draftsection: map viewer

          Discuss this section on GitHub.

          Existing implementations

          All of these tools scale their labels to match the zoom level, but labels of smaller map features can be very small and may not reflect the users text size preference.

          google-maps-embed
          google-maps-api
          openstreetmap-embed
          bing-maps-embed
          mapbox-embed
          leaflet-api
          open-layers-api
          tomtom-sdk
          bing-maps-api
          apple-mapkit-js-api
          full support: (as described above)

          The SVG2 vector-effects property contains a non-scaling-stroke property that allows for an object's stroke to be unaffected by transforms and zoom. This can be used for data visualization, such as graphs or diagrams where an author may want to display a line with a consistent width across a responsive SVG that still respects the browser zoom level, which may otherwise appear too small on mobile screens and too big on larger screens.

          5.4.6 Dynamically load different resolution map tile on zoom

          A limited set of tiles is loaded initially in order to send the user the smallest amount of data required to render the map. When the zoom level is changed, additional tiles should be loaded and rendered seamlessly.

          This capability is related to zoom the map display.

          Issue 152: Capability: Dynamically load different resolution map tile on zoom discussion: capabilitystatus: editor's draftsection: map viewer

          Discuss this section on GitHub.

          Existing implementations

          All reference tools support this capability as described. Google Maps differs from the other reference tools in that it uses colored placeholder tiles in order to provide an indication of the tile type before it has loaded.

          google-maps-embed
          google-maps-api
          openstreetmap-embed
          bing-maps-embed
          leaflet-api
          open-layers-api
          tomtom-sdk
          bing-maps-api
          apple-mapkit-js-api
          full support: (as described above)
          Uses beyond mapping

          Diagram and chart authors on the web often find themselves in a situation where showing different resolutions would be beneficial for performance.

          The HTML Picture element is an example of a native way for authors to specify different versions of an image for display at different sizes. The author can pass as many source elements as needed as child elements of the picture element, and each source has a media attribute that accepts a media query for what environments the referenced file should be used in. For simpler cases (the same image rendered at different resolutions), the srcset and sizes attributes on an HTML <img> element can be used to similar effect. While either syntax may be too verbose for use with map tiles (they require full URLs for every image, at multiple zoom levels, to be specified in the code, and would require the same number of tiles regardless of zoom level) it does serve as an example of this functionality being provided in the HTML specification.

          5.4.7 Hide or show (and maybe dynamically load) vector features and labels on zoom

          By default, web maps allow for the user to control the zoom level. Certain vector features may not be perceivable at higher zoom levels, and thus they should be hidden at higher zoom levels.

          Issue 153: Capability: Hide or show (and maybe dynamically load) vector features and labels on zoom discussion: capabilitystatus: editor's draftsection: map viewer

          Discuss this section on GitHub.

          Existing implementations

          Support for this capability depends on the tileset, but all of the reference tools implement this capability with their default tilesets.

          google-maps-embed
          google-maps-api
          bing-maps-embed
          mapbox-embed
          leaflet-api
          open-layers-api
          tomtom-sdk
          bing-maps-api
          apple-mapkit-js-api
          full support: (as described above)
          Uses beyond mapping

          This is another capability that could have applications in SVG and other drawing-based web specifications. Chart and diagram authors may want to have control over the level of detail displayed at different zoom levels and canvas sizes.

          In SVG, authors most frequently accomplish this by using Media Queries to hide and show elements based on the window size, but this approach is limited to cases where the graphic fills the full document window (or <iframe>). CSS Containment may potentially provide a more elegant solution for allowing authors to manipulate features based on the size of the container rather than the size of the window.

          5.5 Custom styling

          5.5.1 Apply custom styling to map markers and vector features

          When available as an option for map authors, custom styling should be set in a declarative way. Map markers can be either raster or vector images, with all relevant styling properties available to them. Vector features should have a variety of presentational properties available to style them, similar to how SVGs are styled on the web.

          Issue 15: Capability: Apply custom styling to map markers and vector features discussion: capabilitystatus: placeholdersection: map viewer

          Discuss this section on GitHub.

          Existing implementations

          Mapbox is unique amongst the reference tools as it offers a GUI where styling can be applied to each vector feature. Their style editor is extremely powerful, and styles can be applied across particular zoom ranges, data ranges, or even through conditional logic.

          Behind the scenes, Mapbox's styles are stored in a JSON object that conforms to their own Style Specification. The TomTom SDK for Web accepts custom styles in the format of Mapbox's Style Specification.

          For the other reference tools, custom styles can be passed in as a JavaScript object on map initialization. There is significant overlap between the style properties used by these example tools and properties for formats like SVG, such as 'stroke width', 'fill', 'opacity'.

          google-maps-api
          mapbox-embed
          leaflet-api
          open-layers-api
          tomtom-sdk
          bing-maps-api
          apple-mapkit-js-api
          full support: (as described above)
          google-maps-embed
          openstreetmaps-embed
          bing-maps-embed
          no support
          Supported use cases

            SVG elements have many styling properties, describing the fill color or patterns as well as stroke (outline) color, size, and dashing patterns. These are specified using CSS methods (e.g., classes and other selectors) or directly as element attributes. In addition, SVG 2 allows some aspects of the vector shape's geometry to be specified in CSS.

            Custom elements are able to isolate styles via the Shadow DOM, which prevents style selectors defined outside the component to match elements within it, or vice versa, while still allowing some style inheritance. A similar approach could be useful for scoping map specific styling to its containing element.

            Conclusion

            Based on the limited data, we are undecided about whether this should be a requirement.

            5.5.2 Apply custom styling to map controls

            This capability — custom styling — is separate from the ability of the author to create complete custom controls which then control the map viewer using a client-side API.

            Issue 154: Capability: Apply custom styling to map controls discussion: capabilitystatus: editor's draftsection: map viewer

            Discuss this section on GitHub.

            Existing implementations

            Only Leaflet.js and OpenLayers provide a method to style map controls freely. Because these tools are JavaScript libraries and not iframe embeds, their controls can be styled by writing CSS that overrides the default styling. TomTom SDK inherits this capability due to it being a wrapper over Leaflet.js.

            The Google Maps API provides limited options when it comes to styling map controls. The map author has the ability to set which form the controls take (dropdown or horizontal bar), and set the position of the controls.

            leaflet-api
            open-layers-api
            tomtom-sdk
            full support
            google-maps-api
            supported, with limitations
            google-maps-embed
            openstreetmaps-embed
            bing-maps-embed
            mapbox-embed
            bing-maps-api
            apple-mapkit-js-api
            no support:
            Supported use cases

              Custom elements are encapsulated pieces of functionality that can inherit styling from the context that they are in. CSS Shadow Parts allows web component authors to expose named parts within their custom element's shadow DOM, for styling by the web page author. A custom element based approach would allow for map authors to style the map controls without requiring them to implement the logic behind them manually.

              HTML form elements have traditionally lacked ways for web developers to style them, which has led to developers implementing their own versions of form elements in order to apply their own styling, often to the detriment of semantics and accessibility.

              Conclusion

              Based on the limited data, we are undecided about whether this should be a requirement.

              5.5.3 Toggle whether default controls are displayed

              Custom styling isn't always enough; sometimes an author wants to completely replace the default control buttons. Replacing the full functionality of the controls requires a client-side API, discussed separately. This capability focuses solely on the ability to declaratively control whether or not the web browser includes on-screen controls by default.

              Issue 16: Capability: Toggle whether default controls are displayed discussion: capabilitystatus: placeholdersection: map viewer

              Discuss this section on GitHub.

              Existing implementations

              Amongst the reference tools that support this capability, toggling the visibility of default controls is as simple as setting a boolean in a configuration object.

              google-maps-api
              leaflet-api
              open-layers-api
              tomtom-sdk
              bing-maps-api
              apple-mapkit-js-api
              full support: (as described above)
              mapbox-embed
              partial support: you can toggle controls for the HTML slippy map, but not maps created in the more robust Mapbox Studio editor.
              google-maps-embed
              openstreetmaps-embed
              bing-maps-embed
              no support:
              Supported use cases
                Uses beyond mapping

                HTML Media Elements (which consists of the <video> and <audio> element) include a controls attribute that indicate whether or not the author would like the user agent to display controls.

                Conclusion

                Based on the limited data, we are undecided about whether this should be a requirement.

                6. Client-side Mapping API Capabilities

                Client-side Mapping APIs (application programming interfaces) allow website developers to create customized map viewers, or other geographic applications. Existing APIs are JavaScript libraries that offer ready-to-use functions for fetching or rendering parts of a map, or for manipulating a map-viewer widget. A built-in web map solution would need to expose similar DOM APIs to JavaScript code.

                6.1 Creating maps and map components

                6.1.1 Create, initialise, and display a map

                This is the starting point for all API usage.

                Issue 55: Capability: Create, initialise, and display a map discussion: capabilitystatus: placeholdersection: client-side API

                Discuss this section on GitHub.

                Existing implementations

                Implementations differ in how much is expected of the developer wishing simply to initialise and display a map. Those APIs that are tightly bound to a single source of mapping data tend to provide a single method call with options for configuration, whereas APIs that are data-provider-agnostic at least require initialisation of data sources in addition.

                Implementations also differ in the sources and types of mapping data they support. Tiled raster map layers, with additional support for vector layers to provide supplementary content such as routes, are widely supported. Some implementations also support rendering maps using tiled vector map layers or untiled vector data.

                google-maps-api
                bing-maps-api
                apple-mapkit-js-api
                mapbox-gl-api
                leaflet-api
                open-layers-api
                tomtom-sdk

                full support: Google, Bing, MapKit and TomTom allow straightforward creation of a map with configuration options.

                Leaflet, OpenLayers, and MapBox require explicit construction of objects defining the map layers and viewport, with sensible defaults for creation of, for example, a map showing OpenStreetMap tiles in a standard National Imagery and Mapping Agency Technical Report 8350.2, Third Edition projection. This provides added flexibility, at the expense of increasing the complexity of code that uses these libraries.

                d3-geographies-api

                supported, with limitations: The d3-geo module supports vector data in the form of either GeoJSON or TopoJSON. It renders this data to either an SVG or Canvas element. It requires the developer to implement support for interaction using other d3 modules, such as d3-zoom and d3-transition.

                By utilising the d3-tile module, tiled raster data can be combined with vector map data.

                Supported use cases
                Uses beyond mapping

                Leaflet, OpenLayers, and MapBox allow for the creation of layers displaying non-geographical raster tiles.

                The HTML Standard specifies a number of aspects of elements that embed media in a web page and expose JavaScript APIs to enable interaction and dynamic configuration.

                The DOM Standard provides interfaces for creating HTML elements, which are what these implementations are using under the hood.

                Scalable Vector Graphics (SVG) 1.0 Specification provides interfaces for creating vector graphics. These are used as one of the available primary methods of rendering map data by d3-geo, and for rendering supplementary content by other implementations.

                The GeoJSON Format defines a method for representing geographical data in JSON. This is one of the primary data formats supported by d3-geo and is also used by other implementations for representing additional content.

                DOM Standard HTML Standard Scalable Vector Graphics (SVG) 1.0 Specification The GeoJSON Format

                Conclusion

                This functionality is a requirement for modern web maps. Incorporating this functionality of existing map libraries in HTML would benefit users by reducing download size and time to interactivity. Web developers would benefit from being able to program against a standard interface.

                However, it is to be expected that a native HTML web map element would be constructed and initialised via existing DOM interfaces such as document.createElement and DOMElement.insertAdjacentHTML. Additional aspects of the map element's configuration might be achieved either through existing DOMElement interfaces such as setAttribute, or through element-specific attributes and methods; cf. the attributes and methods of the HTMLMediaElement.

                • Accessibility: potential improvement A native implementation would be better able to incorporate a semantically meaningful representation of a map into its accessibility tree than current implementations, which depend on the accessibility features of more general native elements in conjunction with Accessible Rich Internet Applications (WAI-ARIA) 1.1.
                • Performance: potential optimization A native implementation would be more efficient in avoiding the need to download code, in code execution, and potentially in avoiding the necessity of creating complex DOM structures to build the map's representation.
                • Author experience: simple defaults At present, authors need to decide on an implementation to use and to learn how to use it. They may then be unwilling to switch to an alternative implementation for applications in which it would be more suitable. Knowledge of and experience with a standardised native implementation would be more widely applicable.
                • Author maintainability: cost savings Although there are free implementations available, many authors make use of paid implementations whether through inertia or the desire for a paid support route. A native implementation would reduce the operating costs of paid map implementation providers, though they could continue to charge for other services such as tile servers and support, and those savings could (in an ideal world) be passed on to their customers.
                • Consistency: fallbacks possible Existing implementations fail if JavaScript is disabled in the user's browser, or if connectivity failure prevents the necessary scripts being downloaded. A native implementation would be able to at least display an initial view of a map under such conditions, even if further enhancements intended by the author failed to be applied.

                6.1.2 Add a marker or multiple markers to a map

                Markers are discussed in more detail at § 5.2.1 Show pinpoint locations or custom markers on the map. The APIs provided for adding markers to a map generally allow a developer to use default icons or to specify their own, to specify a short label such as a letter or number to be displayed within a marker, and to attach annotations which are displayed when the marker is selected by the user.

                Issue 56: Capability: Add a marker or multiple markers to a map discussion: capabilitystatus: placeholdersection: client-side API

                Discuss this section on GitHub.

                Existing implementations

                Existing implementation support:

                google-maps-api
                bing-maps-api
                apple-mapkit-js-api
                mapbox-gl-api
                leaflet-api
                full support:

                These implementations all provide straightforward APIs for adding markers to locations using a default icon.

                open-layers-api
                supported, with limitations:

                Rather than providing a straightforward API, OpenLayers requires a number of steps to be followed: providing icon imagery (as there is no default imagery provided), creating icon features, creating a map layer to hold those features, and finally adding the layer to a map. This is noticeably more complex than the APIs provided by a number of other implementations.

                d3-geographies-api
                partial support:

                By default, d3-geo will render point features as circles. These can be styled using whatever techniques are being used to style the map content, typically either using presentational SVG attributes, or CSS. In practice, adding markers in a manner similar to that offered by other mapping APIs might best be achieved by dynamically creating a GeoJSON feature containing the point features in a FeatureCollection and adding this as an additional layer on the map.

                Supported use cases
                Uses beyond mapping

                In cases where non-geographical data is being displayed, markers could indicate points of interest in the same way that they do on maps.

                The GeoJSON Format defines a method for representing geographical data in JSON. This is one of the primary data formats supported by d3-geo and is also used by other implementations for representing additional content. For adding markers to a map, a GeoJSON FeatureCollection containing one or more points can be used.

                The GeoJSON Format

                Conclusion

                This functionality is a requirement for modern web maps. Incorporating this functionality of existing map libraries in HTML would benefit users by reducing download size and time to interactivity. Web developers would benefit from being able to program against a standard interface.

                • Accessibility: potential improvement Existing implementations vary widely in how they implement markers and annotations. This lack of consistency has the potential to lead to accessibility issues, as there may be no clear way for the information the marker is intended to denote to be accessed by assistive technologies. A native implementation could expose clearly-defined interfaces for accessing the meaning of the marker and the content of any related annotation.
                • Accessibility: needs author-provided context Although a native implementation could make it easier to expose related content in annotations, it would still be incumbent on authors to ensure that such content was presented in well-structured HTML for assistive technologies to be able to make best use of it.
                • Internationalization: potential improvement (spatial data) Assuming the fundamental content of a marker is its location, a native implementation would be able to present that in a form appropriate for a user's locale.
                • Author experience: simple defaults A consistent interface for creating and showing markers and annotations would be advantageous compared to the widely-varying approaches used by existing implementations.
                • Author experience: customizable design By providing suitable interfaces for specifying the appearance of markers and annotations, a native implementation could allow authors to ensure they were consistent with the overall design of their site.

                6.1.3 Implement a custom control

                Controls are user interface elements that enable interaction with the map. Map implementations typically provide a number of default controls supporting interactions such as zooming and switching layers.

                A map implementation will typically provide the developer with various options for configuring controls. This will include such capabilities as adding and removing controls, showing or hiding them, and being notified of changes in their state. It is also necessary to provide support for controlling the positioning of controls, to avoid the situation where two controls occupy the same position on the map's UI.

                Developers may wish to implement additional controls, either replacing the functionality of the map's default controls, or adding new functionality. Map implementations should provide APIs to support such custom controls, allowing them to integrate fully with the map at a level that is on a par with the map's own controls.

                Discuss this section on GitHub.

                Existing implementations

                Support for controls varies widely among existing map implementations. It is generally the developer's responsibility to create a suitable DOM construct, styled with CSS and augmented with JavaScript to provide behaviour, for use as a control. But though some implementations specify detailed APIs which controls should support in order to be properly integrated with the map, others provide minimal support and expect the developer to take full responsibility for responding to control lifecycle transitions.

                mapbox-gl-api
                leaflet-api
                open-layers-api
                tomtom-sdk
                full support:

                All of these implementations fully support the concept of controls, including support for control implementations to be notified when they are added to or removed from the map, so they can update their own internal state accordingly. They also allow controls to request their desired positioning within the map's UI, and will position controls using sensible defaults if developers choose not to implement that capability.

                MapBoxGL specifies an interface to which controls are expected to conform. The map API provides methods for adding and removing controls to and from the map UI.

                Leaflet, TomTom (which uses Leaflet), and OpenLayers provide base classes which controls extend, along with map methods for adding and removing controls. OpenLayers also exposes its control collection directly.

                google-maps-api
                supported, with limitations:

                While Google Maps supports the adding and removing of controls and the specifying of their placement within a number of predefined areas within the map's UI, there is no specific interface to which they are expected to conform.

                bing-maps-api
                partial support:

                Bing Maps expects controls to be implemented as a type of overlay. It provides no particular support for controls beyond that, not even for positioning them within the map UI, which is left to the developer to achieve using CSS positioning.

                apple-mapkit-js-api
                no supporta>:

                Apple MapkitJS does not provide an interface that can be implemented to create a custom control, nor does it have any generic mechanism for adding and removing controls beyond those provided.

                d3-geographies-api
                not applicable:

                Although d3 supports a variety of user interactions, the concept of a user interface presenting a collection of controls to the user is not part of the library.

                Supported use cases
                Uses beyond mapping

                As controls are explicitly intended as part of the map's user interface, further uses for the concept might be found in other cases where complex interactive content is presented by an element, such as adding controls to media containers.

                Conclusion

                It might seem that, as controls are implemented using existing interactive HTML elements, there is no pressing need for them to be supported by additional APIs. However, the need for them to be closely integrated with a map's own UI, state, and lifecycle suggests that this functionality is a requirement for modern web maps.

                6.1.4 Add a layer to a map

                Adding a layer to a map viewer is a fundamental capability, as without it the base layer itself could not be added to the viewer. While map viewer implementations from a provider of mapping data can be expected to automatically add a base layer showing the data they provide, other implementations require a base layer to be explicitly created and added to the map as part of its initial configuration.

                Adding further map layers other than the base layer allows additional information to be presented to the user in geographical context.

                Discuss this section on GitHub.

                Existing implementations

                All of the reviewed APIs support the creation of alternative base layers for the map, and the addition of layers to the base map. Both raster and vector layers are supported.

                bing-maps-api
                leaflet-api
                open-layers-api
                google-maps-api
                bing-maps-api
                apple-mapkit-js-api
                mapbox-gl-api
                tomtom-sdk
                d3-geographies-api
                full support:

                The implementations from mapping data providers generally require additional configuration to be specified in the case where an alternative base layer that does not use their data is provided.

                Supported use cases
                Uses beyond mapping

                As a map viewer provides the ability to pan and zoom imagery covering a large extent, there are many alternative uses. Some examples include works of art that have been digitised at ultra high resolution, allowing anyone to examine them in fine detail, and ultra high resolution panoramic photographs.

                Conclusion

                Based on the fundamental nature of this capability, it is a requirement for web map APIs. In addition to providing basic and extended capabilites for the display of geographic data, it also allows the repurposing of such APIs for wider application.

                • Author experience: extensible This capability promotes extensibility by allowing authors to incorporate additional or alternative data into a map.
                • Author experience: customizable design This capability allows for customization of both base maps and additional data presented on the map, thereby giving authors flexibility to customize the appearance of maps to suit the design of the site on which the map is displayed.

                6.1.5 Define a data source for a tile layer

                Existing commercial implementations will generally show map data from a preconfigured source, while open-source implementations will either provide or document an initial configuration using open map data. But many applications require the use of alternative sources of map data, and it is therefore necessary that a map implementation provide suitable APIs for the configuration of such sources.

                Configuring alternative data sources is also necessary to support the display of non-geographic tiled imagery.

                Issue 74: Capability: Define a data source for a tile layer discussion: capabilitystatus: placeholdersection: client-side API

                Discuss this section on GitHub.

                Existing implementations

                Existing implementation support:

                google-maps-api
                bing-maps-api
                apple-mapkit-js-api
                mapbox-gl-api
                leaflet-api
                open-layers-api
                tomtom-sdk
                d3-geographies-api
                full support:

                All implementations support the creation of a layer with a specified data source that conforms to an OWS standard. This requires specifying a way for the layer to access the data source, which is achieved by specifying which OWS protocol to use along with a URL template. Some implementations support the use of a URL template function to return the required tile URLs when invoked with arguments specifying the geographical position and extent the required tile should represent.

                Supported use cases
                Uses beyond mapping

                All uses of map implementations to display non-geographical imagery require this capability.

                Conclusion

                Based on the fundamental nature of this capability, it is a requirement for web map APIs. In addition to allowing for the display of alternative geographic data, it also allows the repurposing of such APIs for wider application.

                6.1.6 Create an overlay defined by vector data

                Description to follow

                Issue 155: Capability: Create an overlay defined by vector data discussion: capabilitystatus: placeholdersection: client-side API

                Discuss this section on GitHub.

                Existing implementations

                Existing implementation support:

                leaflet-api
                open-layers-api
                google-maps-api
                bing-maps-api
                apple-mapkit-js-api
                mapbox-gl-api
                d3-geographies-api
                full support:

                All of the API-based map viewer implementations support the use of vector data defined in a number of standard formats, such as GeoJSON and KML. When topogeographical data is available that is not already in one of the widely-supported formats, application developers can readily convert that data into object structures that can be utilised by the existing APIs, such as the structure of a GeoJSON object.

                Supported use cases
                Uses beyond mapping

                ToDo

                Conclusion

                This functionality is a requirement for modern web maps, as there are numerous sources of such data. Furthermore, vector data allows a level of precision higher than that achievable with raster data, or that it may not be convenient or possible to present in the form of rasters.

                • Author experience: simple defaults: existing implementations mostly allow vector data to be incorporated into a map view with a single method call, making it easy for web authors to utilise such data.
                • Author experience: customizable design: the styling of vector data is in the hands of authors, allowing them to easily match it to the design of the containing site.
                • Author experience: extensible: this capability allows authors to incorporate high precision data representations over a base map.
                • Consistency: progressive enhancement: vector data can be incorporated into an HTML document as a list, table, microformat metadata, or similar structured content. The data can then be extracted by a script, formed into a suitable object structure (such as GeoJSON), and rendered on the map.

                6.1.7 Create an overlay defined by heatmap data

                Point intensity data is a useful way of representing the distribution of a phenomenon across geographical areas. Examples include frequency of earthquake occurrence in different regions, the distribution of types of vegetation found in an area, or the spread of a global pandemic at a particular point in time.

                It is possible to preprocess such data into a raster or vector format for display, but giving a map implementation the capability of rendering such data into an overlay directly averts such problems as maintaining consistency between multiple representations of the same data. Implementations will commonly accept point intensity data defined in a number of standard vector data formats, such as KML or GeoJSON.

                Issue 156: Capability: Create an overlay defined by heatmap data discussion: capabilitystatus: placeholdersection: client-side API

                Discuss this section on GitHub.

                Existing implementations

                Existing implementation support:

                google-maps-api
                mapbox-gl-api
                open-layers-api
                full support:

                All of these implementations support the display of point intensity data as a heatmap. In the case of Google Maps, it is necessary to specify the inclusion of support declaratively when loading the script library. Typically, a vector data source object is defined in JavaScript either by specifying the URL of a resource or by specifying the data directly in code.

                bing-maps-api
                leaflet-api
                tomtom-sdk
                d3-geographies-api
                partial support:

                Bing Maps has native support for heatmaps via a separate module that must be explicitly loaded in JavaScript, rather than being specified declaratively in HTML. Leaflet (and by extension TomTom) and d3 have third-party plugins available which add support.

                apple-mapkit-js-api
                not applicable:

                MapKit JS does not support a heatmap overlay at present, and no third-party plugins adding support are known of.

                Supported use cases
                Uses beyond mapping

                Heatmaps have existing applications unrelated to geography in a number of fields. For example, they are used in molecular biology for such purposes as visualizing gene expression. An implementation capable of displaying non-geographic point intensity data would therefore have potential value in the display of such data on the web.

                Conclusion

                This functionality could be added to enhance native web maps in the future.

                • Accessibility: potential improvement Existing implementations only allow access to the underlying data represented by a heatmap if the author explicitly provides it, for example by also including the source data in an HTML table. A native implementation has the potential to improve access to the data. Furthermore, the choice of colours used in the heatmap may present problems for users with visual impairments. A native implementation could expose controls to allow users to select an alternative palette, such as a high-contrast version.
                • Performance: potential optimization Rendering a heatmap from data can be computationally expensive, and it may be possible for a native implementation to achieve greater efficiency.

                6.1.8 Control which layers are included in a map

                Description to follow

                Issue 63: Capability: Control which layers are included in a map discussion: capabilitystatus: placeholdersection: client-side API

                Discuss this section on GitHub.

                Existing implementations

                Existing implementation support:

                leaflet-api
                open-layers-api
                google-maps-api
                bing-maps-api
                apple-mapkit-js-api
                mapbox-gl-api
                tomtom-sdk
                d3-geographies-api
                full support: All of these implementations allow hiding and showing a layer on a map.
                Supported use cases
                Uses beyond mapping

                ToDo

                Conclusion

                Based on the limited data, we are undecided about whether this should be a requirement.

                6.1.9 Specify the style of a map

                Description to follow

                Discuss this section on GitHub.

                Existing implementations

                Existing implementation support:

                google-maps-api
                bing-maps-api
                apple-mapkit-js-api
                mapbox-gl-api
                leaflet-api
                open-layers-api
                d3-geographies-api
                not applicable:
                Supported use cases
                Uses beyond mapping

                ToDo

                Conclusion

                Based on the limited data, we are undecided about whether this should be a requirement.

                6.1.10 Determine the current style of a map

                Description to follow

                Issue 66: Capability: Determine the current style of a map discussion: capabilitystatus: placeholdersection: client-side API

                Discuss this section on GitHub.

                Existing implementations

                Existing implementation support:

                google-maps-api
                bing-maps-api
                apple-mapkit-js-api
                mapbox-gl-api
                leaflet-api
                open-layers-api
                d3-geographies-api
                not applicable:
                Supported use cases
                Uses beyond mapping

                ToDo

                Conclusion

                Based on the limited data, we are undecided about whether this should be a requirement.

                6.2 Controlling the displayed map view and responding to user actions

                6.2.1 Get the bounds of a map

                Description to follow

                Discuss this section on GitHub.

                Existing implementations

                Existing implementation support:

                google-maps-api
                bing-maps-api
                apple-mapkit-js-api
                mapbox-gl-api
                leaflet-api
                open-layers-api
                d3-geographies-api
                full support:
                Supported use cases
                Uses beyond mapping

                ToDo

                Conclusion

                Based on the limited data, we are undecided about whether this should be a requirement.

                6.2.2 Pan, zoom, or re-centre a map

                Developers expect to be able to control a map by changing its centre and/or zoom level, and may also wish to support the capability of resetting a map to its view as originally presented. If the map view cannot be dynamically modified by an application, as opposed to changes by direct user interaction with the map, then it offers fewer advantages over a static map view.

                It is usually also desirable that such changes can be accomplished in a manner that gives sufficient visual feedback to the user that a change is occurring, for example by animating the transition rather than simply redrawing the map with the new view, which may not be immediately noticeable to the user.

                Accessibility is an important consideration when the state of a map is altered dynamically. Thought should be given to how the change can be made known to assistive technologies so that the user is fully informed and thus cognisant of the current state of the map at all times.

                Discuss this section on GitHub.

                Existing implementations

                All the reviewed JavaScript API implementations support changing the bounds, centre, and zoom level of a map, and allow such transitions to be animated.

                google-maps-api
                bing-maps-api
                apple-mapkit-js-api
                mapbox-gl-api
                leaflet-api
                open-layers-api
                d3-geographies-api
                full support:

                Animated transitions are supported by calling specific methods with names such as flyTo or via a Boolean parameter to a more general method such as setView.

                Supported use cases
                Uses beyond mapping

                This capability would be relevant to use of web map technology for the display of non-geographic imagery, such as navigating the view to relevant parts of a complex diagram as the user progresses through related content.

                [css-overflow] Consider adding new CSS primitive for per-element panning and zooming (for web maps) #5275

                Conclusion

                As this is capability is required for any dynamic update of a map view such as would be expected of a map-based application, it is a requirement for embedded web maps.

                • Privacy: potential improvement As there is the potential for third-party scripts to observe the panning and zooming of a map, there is a risk with current implementations of this feature exposing an individual's or corporation's interest in particular locations. This risk would be mitigated with appropriate browser-level security.
                • Accessibility: potential improvement Current implementations can only represent changes in the map state in a semantically meaningful form to a limited degree via such mechanisms as Accessible Rich Internet Applications (WAI-ARIA) 1.1 live regions. A browser implementation would be better able to provide meaningful representations of such changes to assistive technologies.
                • Performance: potential optimization As current implementations rely on extensive manipulation of DOM nodes to achieve these effects, it is probable that a native implementation would be much more efficient.

                6.2.3 Subscribe to notifications of map events

                A web application embedding a map will commonly need to respond to changes in the state of the map, whether as a result of user activity or from other causes, so that it can update its own internal state and user interface as necessary to remain consistent with the map view. At a minimum, any change of the area displayed by the map needs to be notified to the application. In practice, it is usually desirable for other high-level events within the map view to be exposed as well. This allows an application fine-grained control of the level of detail of interactions it responds to, from simple updates when the map is moved or the zoom level is changed, to detailed feedback during user interactions of longer duration such as continuous panning.

                In addition to events relating to the state of the map view itself, developers will expect to be able to receive notifications of events triggered by other components within the map such as controls, markers, and layers.

                A native HTML map element would be expected to support the existing DOM event binding interface, using the standard addEventListener() method to bind listener functions to map events, and receiving an object derived from the standard Event interface as the argument to such functions.

                Discuss this section on GitHub.

                Existing implementations

                Implementations of map events vary widely in both the terminology used and the semantic richness of the events available. For example, the Google Maps API provides events named center_changed and zoom_changed, allowing a developer to provide discrete event handlers for such changes. The Leaflet API supports similar events, but named moveend and zoomend. The Bing Maps API, on the other hand, provides a more general viewchangeend event, and the handler for this event must examine the state of the map to determine what has changed.

                APIs generally also provide lower level events directly correlating to user interactions, such as click and mouseover in the Google Maps API, though again terminology varies. The event objects passed to handlers of such events have additional properties compared to their equivalents in normal DOM event handling, such as a property giving the position of the event in terms of latitude and longitude.

                google-maps-api
                bing-maps-api
                apple-mapkit-js-api
                mapbox-gl-api
                leaflet-api
                open-layers-api
                tomtom-sdk
                d3-geographies-api
                supported, with limitations:

                Although all existing implementations support an events system capable of meeting the needs of developers, inconsistencies in terminology, semantic richness, and the interfaces provided for adding and removing event listeners mean that it is unclear whether any one of the existing APIs would be a suitable model for the various capabilities available across the entire range of them.

                Supported use cases
                Uses beyond mapping

                As it is anticipated that standard DOM event interfaces would be the basis for an HTML map's event system, it is likely that further uses could arise for such capabilities. For example, an HTML text annotated with geographical microdata could allow DOM events arising from user interaction (such as clicking on the name of a city within the text) to be enhanced with the same kind of position property, specifying latitude and longitude, as would be present in an event object created by a similar interaction with a map element.

                As outlined above, it is expected that events as defined in DOM Standard would form the basis for a map element's event system.

                HTML Standard media objects provide an existing example of extending the basic event system to support particular capabilities of embedded content.

                Conclusion

                This capability is a requirement for the scripting API of a native HTML map element. Responding to changes in the state of a map, or user interactions with elements of the map such as markers, is necessary for a web application to usefully modify its own state so as to reflect the results of such interactions.

                • Privacy: reveals sensitive data Collating the positions on which a user centres the map could allow a script to infer an interest in a particular region and, for example, target advertising accordingly.
                • Accessibility: potential improvement If events from maps and map interface elements are exposed to assistive technologies via the browser's existing accessibility mechanisms, it would be easier for those technologies to present them in a way consistent with other browser interactions.
                • Performance: potential optimization Existing implementations must perform complex tasks such as transforming browser coordinates to map coordinates in order to provide such data in enhanced event objects. Native implementations could be expected to provide significantly better performance.
                • Author experience: extensible The ability to respond to user interaction is crucial in building rich application interfaces that include embedded maps.
                • Author maintainability: cost savings A standardised interface against which to write event-driven mapping applications reduces the amount of time developers need to spend becoming competent and productive.
                • Consistency: established patterns Current implementations already seek to either extend or mimic the existing event mechanism.
                • Consistency: progressive enhancement An application can determine which event-driven enhancements it is capable of supporting in a given environment.
                • Consistency: fallbacks possible An application can choose not to subscribe to a given event or events if it determines that it cannot usefully provide an enhancement in its current environment.

                6.2.4 Change the bearing of a map

                Although the default bearing of a map - that is, the direction of "up" - is usually north, it can be useful to change this.

                Discuss this section on GitHub.

                Existing implementations

                Existing implementation support:

                open-layers-api
                apple-mapkit-js-api
                mapbox-gl-api
                d3-geographies-api
                full support: these implementations all permit the bearing of a map view to be changed.
                google-maps-api
                bing-maps-api
                leaflet-api
                no support: these implemtations provide no support for changing the bearing of the map.
                Supported use cases
                Uses beyond mapping

                This capability could be useful when a map viewer is used to display zoomable technical drawings.

                Conclusion

                This functionality could be added to enhance native web maps in the future.

                6.2.5 Move the map to display a given location

                An API should support allowing the map to be moved to display a given location.

                Issue 157: Capability: Move the map to display a given location discussion: capabilitystatus: editor's draftsection: client-side API

                Discuss this section on GitHub.

                Existing implementations

                Existing implementation support:

                google-maps-api
                bing-maps-api
                apple-mapkit-js-api
                mapbox-gl-api
                leaflet-api
                open-layers-api
                d3-geographies-api
                not applicable:
                Supported use cases
                Uses beyond mapping

                ToDo

                Conclusion

                This functionality is a requirement for modern web maps.

                6.2.6 Pan and zoom a map so as to completely show the area covered by a given bounding box

                Description to follow

                Issue 158: Capability: Pan and zoom a map so as to completely show the area covered by a given bounding box discussion: capabilitystatus: placeholdersection: client-side API

                Discuss this section on GitHub.

                Existing implementations

                Existing implementation support:

                google-maps-api
                bing-maps-api
                apple-mapkit-js-api
                mapbox-gl-api
                leaflet-api
                open-layers-api
                d3-geographies-api
                not applicable:
                Supported use cases
                Uses beyond mapping

                ToDo

                Conclusion

                Based on the limited data, we are undecided about whether this should be a requirement.

                6.2.7 Animate the re-centering of the map view

                Description to follow

                Issue 159: Capability: Animate the re-centering of the map view discussion: capabilitystatus: placeholdersection: client-side API

                Discuss this section on GitHub.

                Existing implementations

                Existing implementation support:

                google-maps-api
                bing-maps-api
                apple-mapkit-js-api
                mapbox-gl-api
                leaflet-api
                open-layers-api
                d3-geographies-api
                not applicable:
                Supported use cases
                  Uses beyond mapping

                  ToDo

                  Conclusion

                  This functionality could be added to enhance native web maps in the future.

                  6.2.8 Animate the zooming of the map

                  Description to follow

                  Discuss this section on GitHub.

                  Existing implementations

                  Existing implementation support:

                  google-maps-api
                  bing-maps-api
                  apple-mapkit-js-api
                  mapbox-gl-api
                  leaflet-api
                  open-layers-api
                  d3-geographies-api
                  not applicable:
                  Supported use cases
                  Uses beyond mapping

                  ToDo

                  Conclusion

                  This functionality could be added to enhance native web maps in the future.

                  6.2.9 Animate the re-centering of the map

                  Description to follow

                  Issue 161: Capability: Animate the re-centering of the map discussion: capabilitystatus: placeholdersection: client-side API

                  Discuss this section on GitHub.

                  Existing implementations

                  Existing implementation support:

                  google-maps-api
                  bing-maps-api
                  apple-mapkit-js-api
                  mapbox-gl-api
                  leaflet-api
                  open-layers-api
                  d3-geographies-api
                  not applicable:
                  Supported use cases
                  Uses beyond mapping

                  ToDo

                  Conclusion

                  Based on the limited data, we are undecided about whether this should be a requirement.

                  7. Map Data Formats for Map Viewers

                  Many different types of spatial data can be integrated in a web map: satellite imagery, cartographic representations of roads and terrain, 3D building profiles, pinpoint locations with annotated descriptions, route directions or other polyline paths, and more. Many standard and proprietary formats exist to describe this data.

                  A built-in web map viewer will need to work with spatial data that is already available from web servers, or that can be provided with minor server upgrades.

                  7.1 Vector feature data formats

                  7.2 Map projections and coordinate reference systems

                  7.3 Server APIs

                  8. Summary of Requirements

                  To Do: finish the script to generate a summary table from the annotated markup.

                  A. Open Issues

                  We are tracking issues on Github.

                  B. Acknowledgments

                  C. References

                  C.1 Informative references

                  [API-DESIGN-PRINCIPLES]
                  Web Platform Design Principles. Sangwhan Moon. W3C. 23 September 2021. W3C Working Group Note. URL: https://www.w3.org/TR/design-principles/
                  [ATAG20]
                  Authoring Tool Accessibility Guidelines (ATAG) 2.0. Jan Richards; Jeanne F Spellman; Jutta Treviranus. W3C. 24 September 2015. W3C Recommendation. URL: https://www.w3.org/TR/ATAG20/
                  [css-contain-1]
                  CSS Containment Module Level 1. Tab Atkins Jr.; Florian Rivoal. W3C. 22 December 2020. W3C Recommendation. URL: https://www.w3.org/TR/css-contain-1/
                  [css-nav-1]
                  CSS Spatial Navigation Level 1. Jihye Hong; Florian Rivoal. W3C. 26 November 2019. W3C Working Draft. URL: https://www.w3.org/TR/css-nav-1/
                  [css-shadow-parts-1]
                  CSS Shadow Parts. Tab Atkins Jr.; Fergal Daly. W3C. 15 November 2018. W3C Working Draft. URL: https://www.w3.org/TR/css-shadow-parts-1/
                  [css-transforms-1]
                  CSS Transforms Module Level 1. Simon Fraser; Dean Jackson; Theresa O'Connor; Dirk Schulze. W3C. 14 February 2019. W3C Candidate Recommendation. URL: https://www.w3.org/TR/css-transforms-1/
                  [DOM]
                  DOM Standard. Anne van Kesteren. WHATWG. Living Standard. URL: https://dom.spec.whatwg.org/
                  [EXTENSIBLE]
                  The Extensible Web Manifesto. 10 June 2013. URL: https://extensiblewebmanifesto.org/
                  [FAST]
                  Framework for Accessible Specification of Technologies. W3C Accessible Platform Architectures Working Group (APA WG). URL: https://w3c.github.io/apa/fast/
                  [filter-effects]
                  Filter Effects Module Level 1. Dirk Schulze; Dean Jackson. W3C. 18 December 2018. W3C Working Draft. URL: https://www.w3.org/TR/filter-effects-1/
                  [fullscreen]
                  Fullscreen API Standard. Philip Jägenstedt. WHATWG. Living Standard. URL: https://fullscreen.spec.whatwg.org/
                  [geolocation-API]
                  Geolocation API Specification 2nd Edition. Andrei Popescu. W3C. 8 November 2016. W3C Recommendation. URL: https://www.w3.org/TR/geolocation-API/
                  [GEOLOCATION-PRIVACY]
                  Privacy of Geolocation Implementations. Marcos Cáceres. 12 July 2010. URL: https://www.w3.org/2010/api-privacy-ws/papers/privacy-ws-21.pdf
                  [geolocation-sensor]
                  Geolocation Sensor. Anssi Kostiainen; Thomas Steiner; Marijn Kruisselbrink. W3C. 2 September 2021. W3C Working Draft. URL: https://www.w3.org/TR/geolocation-sensor/
                  [HTML]
                  HTML Standard. Anne van Kesteren; Domenic Denicola; Ian Hickson; Philip Jägenstedt; Simon Pieters. WHATWG. Living Standard. URL: https://html.spec.whatwg.org/multipage/
                  [html-design-principles]
                  HTML Design Principles. Anne van Kesteren; Maciej Stachowiak. W3C. 26 November 2007. W3C Working Draft. URL: https://www.w3.org/TR/html-design-principles/
                  [international-specs]
                  Internationalization Best Practices for Spec Developers. Richard Ishida; Addison Phillips. W3C. 25 March 2021. W3C Working Draft. URL: https://www.w3.org/TR/international-specs/
                  [MapML]
                  Map Markup Language (MapML) specification. Peter Rushforth; Robert Linder; Joan Masó. W3C Maps for HTML Community Group. Draft Community Group Report. URL: https://maps4html.org/MapML/spec/
                  [media-accessibility-reqs]
                  Media Accessibility User Requirements. Shane McCarron; Michael Cooper; Mark Sadecki. W3C. 3 December 2015. W3C Working Group Note. URL: https://www.w3.org/TR/media-accessibility-reqs/
                  [media-frags]
                  Media Fragments URI 1.0 (basic). Raphaël Troncy; Erik Mannens; Silvia Pfeiffer; Davy Van Deursen. W3C. 25 September 2012. W3C Recommendation. URL: https://www.w3.org/TR/media-frags/
                  [mediaqueries-4]
                  Media Queries Level 4. Florian Rivoal; Tab Atkins Jr.. W3C. 21 July 2020. W3C Candidate Recommendation. URL: https://www.w3.org/TR/mediaqueries-4/
                  [Microdata]
                  HTML Microdata. Charles 'chaals' (McCathie) Nevile; Dan Brickley; Ian Hickson. W3C. 28 January 2021. W3C Working Group Note. URL: https://www.w3.org/TR/microdata/
                  [payment-request]
                  Payment Request API. Marcos Caceres; Rouslan Solomakhin; Ian Jacobs. W3C. 30 September 2021. W3C Proposed Recommendation. URL: https://www.w3.org/TR/payment-request/
                  [personalization-semantics-requirements-1.0]
                  Requirements for Personalization Semantics. Lisa Seeman-Horwitz; Charles LaPierre; Michael Cooper; Ruoxi Ran. W3C. 28 October 2020. W3C Working Draft. URL: https://www.w3.org/TR/personalization-semantics-requirements-1.0/
                  [picture-in-picture]
                  Picture-in-Picture. Francois Beaufort; Mounir Lamouri. W3C. 30 August 2021. W3C Working Draft. URL: https://www.w3.org/TR/picture-in-picture/
                  [rfc7946]
                  The GeoJSON Format. H. Butler; M. Daly; A. Doyle; S. Gillies; S. Hagen; T. Schaub. IETF. August 2016. Proposed Standard. URL: https://www.rfc-editor.org/rfc/rfc7946
                  [security-privacy-questionnaire]
                  Self-Review Questionnaire: Security and Privacy. Theresa O'Connor; Peter Snyder. W3C. 23 September 2021. W3C Working Group Note. URL: https://www.w3.org/TR/security-privacy-questionnaire/
                  [SVG]
                  Scalable Vector Graphics (SVG) 1.0 Specification. Jon Ferraiolo. W3C. 4 September 2001. W3C Recommendation. URL: https://www.w3.org/TR/SVG/
                  [SVG2]
                  Scalable Vector Graphics (SVG) 2. Amelia Bellamy-Royds; Bogdan Brinza; Chris Lilley; Dirk Schulze; David Storey; Eric Willigers. W3C. 4 October 2018. W3C Candidate Recommendation. URL: https://www.w3.org/TR/SVG2/
                  [UAAG20]
                  User Agent Accessibility Guidelines (UAAG) 2.0. James Allan; Greg Lowney; Kimberly Patch; Jeanne F Spellman. W3C. 15 December 2015. W3C Working Group Note. URL: https://www.w3.org/TR/UAAG20/
                  [wai-aria-1.1]
                  Accessible Rich Internet Applications (WAI-ARIA) 1.1. Joanmarie Diggs; Shane McCarron; Michael Cooper; Richard Schwerdtfeger; James Craig. W3C. 14 December 2017. W3C Recommendation. URL: https://www.w3.org/TR/wai-aria-1.1/
                  [WCAG21]
                  Web Content Accessibility Guidelines (WCAG) 2.1. Andrew Kirkpatrick; Joshue O'Connor; Alastair Campbell; Michael Cooper. W3C. 5 June 2018. W3C Recommendation. URL: https://www.w3.org/TR/WCAG21/
                  [web-share]
                  Web Share API. Matt Giuca; Eric Willigers; Marcos Caceres. W3C. 22 November 2021. W3C Working Draft. URL: https://www.w3.org/TR/web-share/
                  [webcomponents-design-guidelines]
                  Guidelines for creating web platform compatible components. W3C TAG. URL: https://www.w3.org/2001/tag/doc/webcomponents-design-guidelines/
                  [webGL]
                  WebGL 2.0 Specification. Dean Jackson; Jeff Gilbert. Khronos. 12 August 2017. URL: https://www.khronos.org/registry/webgl/specs/latest/2.0/
                  [WGS84]
                  National Imagery and Mapping Agency Technical Report 8350.2, Third Edition. National Imagery and Mapping Agency. 3 January 2000.